Archive for the 'QM Method' Category

Tridehydrobenzene

In section 4.4 of the book, I discuss in great detail the computational (and some experimental) studies of the benzynes, the formal diradicals created by loss of two hydrogen atoms from benzene. Now comes a very nice experimental study on a molecule that takes the next step: 1,3,5-tridehydrobenzene 1, benzene that lacks three hydrogen atoms. Sander reports the preparation and characterization of trifluoro-1,3,5-tridehydrobenzene 2.1 The characterization of this novel molecule is made through comparison with computed IR spectra.

2 is prepared by flash vapor pyrolysis of 1,3,5-triiodo-2,4,6-trifluorobenezene
and then trapping the products in a low temperature matrix. Sander identifies five IR peaks of a product he believes is 2. These IR frequencies are listed in Table 1.

Table 1. Experimental and computeda IR frequencies (cm-1) and relative intensities of 2.

Expt

2a

2bb

ν

I

ν

I

ν

I

954

60

921.7

57

976.2

57

1030

30

997.6

54

1016.0

55

1266

40

1221.8

35

1291.3

33


1310.6

16

1325.4

30

1560

70

1530.0

73

1572.6

100

1738

100

1726.6

100

1690.6

88

aUBLYP/cc-pVTZ. bTransition state.

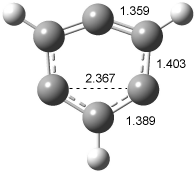
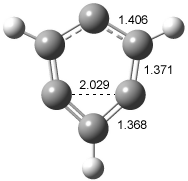
In order to confirm that this IR spectra comes from 2, Sander computed the structure and IR frequencies of both 1 and 2. The 2A1 structure of 1 had been studied previously2, but what had gone unnoticed is that another structure is possible, the 2B2 state. These two states differ in the separation between C1 and C3. When the distance is short, the SOMO is of a1 symmetry and this orbital has bonding character between these two carbon centers, giving rise to the 2A1 state (1a). As the distance gets longer between C1 and C3, a b2 orbital, having antibonding character between C1and C3, becomes lower in energy than the a1 orbital, so that the structure is 2B2 (1b). The UBLYP/cc-pVTZ optimized structures are shown in Figure 1. 1a is 2-3 kcal mol-1 lower in energy than 1b. Furthermore, 1b has one imaginary frequency and is not a local energy minimum. Sander also optimized the structures of 2a and 2b¸ finding little effect due to the fluorine substitution.

1a

1b

Figure 1. UBLYP/cc-pVTZ optimized structures of 1a (2A1) and 1b (2B1).

The computed IR frequencies are listed in Table 1. The computed frequencies (and their relative intensities) of 2a match up strikingly well with those of the experiment. Sander concludes that 2a has in fact been prepared and characterized.

References

(1) Venkataramani, S.; Winkler, M.; Sander, W., "Trifluoro-1,3,5-tridehydrobenzene," Angew. Chem. Int. Ed. 2007, 46, 4888-4893, DOI: 10.1002/anie.200700536

(2) Cristian, A. M. C.; Shao, Y.; Krylov, A. I., "Bonding Patterns in Benzene Triradicals from Structural, Spectroscopic, and Thermochemical Perspectives," J. Phys. Chem. A 2004, 108, 6581-6588, DOI: 10.1021/jp049007j.

InChI:

1: InChI=1/C6H3/c1-2-4-6-5-3-1/h1,4-5H
2: InChI=1/C6F3/c7-4-1-5(8)3-6(9)2-4

benzynes &DFT Steven Bachrach 20 Aug 2007 No Comments

Which is the Most Acidic Proton of Cysteine?

Kass has once again uncovered a simple system that challenges our notions of basic chemical concepts. It is a well accepted notion that the most acidic proton of all of the amino acids is the carboxylic acid one. However, acidities are strongly influenced by the solvent, and the absence of solvent in the gas phase can dramatically alter things.

Kass and co-workers examined the gas-phase acidity of cysteine with computational and
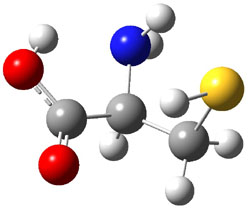
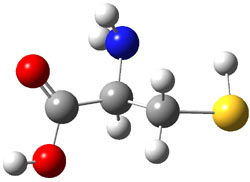
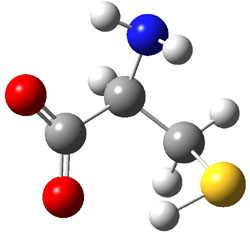
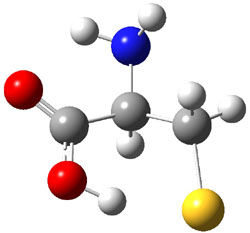
experimental techniques.1 The lowest energy conformer of cysteine is 1a, characterized by having three intramolecular hydrogen bonds (Figure 1). The next lowest conformer, 1b, has only two intramolecular hydrogen bonds and is 1.5 kcal mol-1 higher in energy at G3B3.

1a
xyz

1b
xyz

Figure 1. B3LYP/aug-cc-pVDZ optimized structures of cysteine 1.1

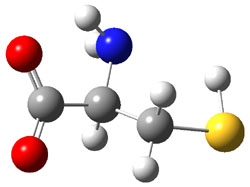
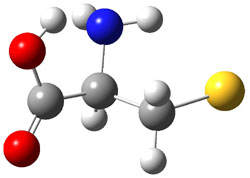
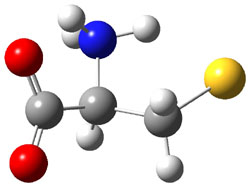
They optimized a number of different configurations of the conjugate base of cysteine: two conformers from the loss of the carboxylate proton (2a and 2b), two conformers from the loss of the thiol proton (2c and 2d), and one conformer from the loss of the thiol proton of the zwitterion (2e). These structures are shown in Figure 2 along with their relative energies. All of these structures possess two intramolecular hydrogen bonds.

2a
(3.1)
xyz

2b
(3.4)
xyz

2c
(0.0)
xyz

2d
(5.1)
xyz


2e
(10.1)
xyz


Figure 2. B3LYP/aug-cc-pVDZ optimized structures of the conjugate base of cysteine 2. Relative energies (kcal mol-1) in parenthesis computed at G3B3.1

The gas phase acidity of carboxylic acids is greater than thiols; the deprotonation energy of propanoic acid (CH3CH2CO2H) is 347.7 kcal mol-1 at G3B3 (347.2 expt.2), about 6 kcal mol-1 less than that of ethanethiol (CH2CH2SH: 355.0 at G3B3 and 354.2 expt.2). However, the computations indicate that 2c is the lowest energy structure of deprotonated cysteine, and 2c comes about by loss of the thiol proton! Te lowest energy cysteine conjugate base from loss of the carboxylate proton is 1a, which is 3.1 kcal mol-1 higher in energy. Apparently, the hydrogen bonding network in 2c is quite favorable, able to make up for the inherent favorability of a carboxylate over a thiolate anion.

The G3B3 computed deprotonation energy of cysteine is 333.3 kcal mol-1 (for removal of the thiol proton). Kass determined the deprotonation energy of cysteine using a kinetic and a thermodynamic method. The kinetic method gives a value of 332.9 ± 3.3 kcal mol-1­, while the thermodynamic method gives 334.4 ± 3.3 kcal mol-1­. These are in fine agreement with the computed value.

This study ably demonstrates the dramatic role that solvent can play in determining molecular properties. Kass titled the article “Are carboxyl groups the most acidic sites in amino acids?” and answers with “no” – in the gas phase the thiol group is more acidic. He ends the article with an indication that the alcohol of tyrosine may be competitive in acidity with its carboxylic group, too.

References

(1) Tian, Z.; Pawlow, A.; Poutsma, J. C.; Kass, S. R., "Are Carboxyl Groups the Most Acidic Sites in Amino Acids? Gas-Phase Acidity, H/D Exchange Experiments, and Computations on Cysteine and Its Conjugate Base," J. Am. Chem. Soc., 2007, 129, 5403-5407, DOI: 10.1021/ja0666194.

(2) NIST, NIST Chemistry WebBook, 2005, http://webbook.nist.gov/.

InChIs

1: InChI=1/C3H7NO2S/c4-2(1-7)3(5)6/h2,7H,1,4H2,(H,5,6)

Acidity &amino acids &G3 &Kass Steven Bachrach 16 Aug 2007 3 Comments

Predicting the structure of artarborol

Here’s one more nice application of computationally-derived NMR chemical shifts towards solving a structure. Fattarusso and co-workers1 identified a component of wormwood called artarborol. COSY and ROESY experiments allowed for deducing four possible diasereomeric structures of artarborol, 1-4.

They then took two computational approaches towards resolving the structure. First, they performed an MM search for low energy conformers of 1-4. These conformers were then screened for those having a dihedral angle of around 90° for the C-8 and C-9 protons, due to a low couple constant for between these protons. Only conformers of 1 and 3 satisfied this criterion. An intense couple of the H-1 and H-5 protons indicated a transannular arrangement, and only conformers of 1 satisfy this criterion.

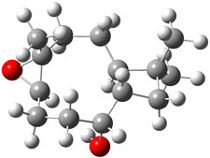
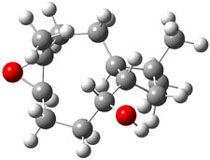
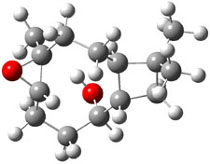
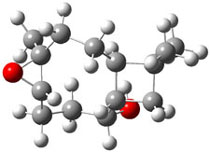
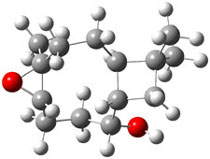
The second computational approach was to optimize some of the low energy conformers of 1 and 3 at mPW1PW91/6-31G(d,p) and compute their 13C chemical shifts. The five low energy conformers, two of 1 and three of 3, are shown in Figure 1. The resulting chemical shifts were averaged according to a Boltzmann distribution. These computed chemical shifts were then fit against the experimental values. The correlation factor for the computed shifts for 1 (r2=0.9997) was much better than that of 3 (r2=0.9713). The average deviation of the chemical shifts (after being corrected using the fitting procedure from the above correlation) was only 0.8ppm for 1 but 2ppm for 3. They therefore conclude that the structure of artarborol is 1.

1a
xyz

1b
xyz


3a
xyz

3b
xyz

3c
xyz

Figure 1. mPW1PW91 optimized conformations of possible artarborol diasteromers.1

References

(1) Fattorusso, C.; Stendardo, E.; Appendino, G.; Fattorusso, E.; Luciano, P.; Romano, A.; Taglialatela-Scafati, O., "Artarborol, a nor-Caryophyllane Sesquiterpene Alcohol from Artemisia arborescens. Stereostructure Assignment through Concurrence of NMR Data and Computational Analysis," Org. Lett., 2007, 9, 2377-2380, DOI: 10.1021/ol070803s.

(2) I thank Professor Ernesto Fattorusso for supplying me with the optimized coordinates of these compounds.

InChI

1: InChI=1/C14H24O2/c1-13(2)8-9-10(13)6-7-14(3)12(16-14)5-4-11(9)15/h9-12,15H,4-8H2,1-3H3/t9-,10-,11-,12-,14+/m0/s1

DFT &NMR Steven Bachrach 13 Aug 2007 No Comments

Nucleophilic Substitution at Phosphorus

Just a short update here. In Chapter 5.1.2 we discuss nucleophilic substitution at heteroatoms. Unlike the paradigmatic case for substitution at carbon, which proceeds via the SN2 mechanism. Nucleophilic substitution at second-row atoms (S, Si, P) appears to follow an addition-elimination pathway. Bickelhaupt1 now adds a more thorough computational examination of nucleophilic substitution at phosphorus. He looked at a few identity reactions involving tricoordinate P, namely

X + PH2X → PH2X + X

X + PF2X → PF2X + X

X + PCl2X → PCl2X + X

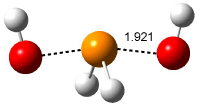
where X is chloride or hydroxide. In all cases the only critical point located on the potential energy surface is for a tetracoordinate intermediate. Shown in Figure 1 are the intermediates for the reaction OH + PH2OH and Cl + PCl3. This result is consistent with the studies of nucleophilic substitution at sulfur and silicon.

(a)

int2

xyz file

(b)

int1

xyz file

Figure 1. OLYP/TZ2P optimized intermediate for the reaction (a) OH + PH2OH
and (b) Cl + PCl3.

References:

(1) vanBochove, M. A.; Swart, M.; Bickelhaupt, F. M., "Nucleophilic Substitution at Phosphorus (SN2@P): Disappearance and Reappearance of Reaction Barriers," J. Am. Chem. Soc. 2006, 128, 10738-10744, DOI: 10.1021/ja0606529

DFT &Substitution Steven Bachrach 03 Aug 2007 No Comments

Problems with DFT – an Update

I just ran across a nice summary article by Peter Schreiner1 detailing the recent spate of articles describing problems with many DFT methods, especially the ubiquitous B3LYP functional. This article covers essentially the same ground as my previous post Problems with DFT.

References

(1) Schreiner, P. R., “Relative Energy Computations with Approximate Density Functional Theory – A Caveat!,” Angew. Chem. Int. Ed., 2007, 46, 4217-4219, DOI: 10.1002/anie.200700386.

DFT &Schreiner Steven Bachrach 02 Aug 2007 2 Comments

Predicting NMR chemical shifts

Another three applications of computed NMR chemical shifts towards structure identification have appeared, dealing with carbohydrates and natural products.

Prediction of NMR Signals of Carbohydrates

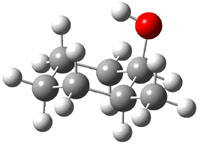
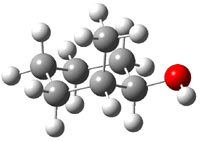
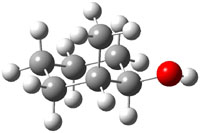
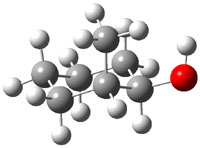
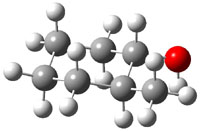
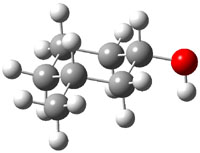
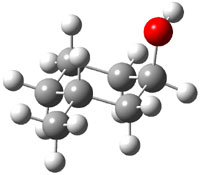
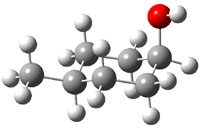
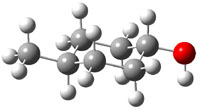
The study by Cramer and Hoye1 investigates identification of diastereomers with NMR, in particular, identification of cis and trans isomers of 2-methyl- (1), 3-methyl- (2), and 4-methylcyclohexanol (3). The study discusses the ability of different DFT methods to predict the chemical shifts of these alcohols in regard to distinguishing their different configurations. An interesting twist is that they have developed a functional specifically suited to predict proton chemical shifts and a second functional specifically for predicting carbon chemical shifts.2

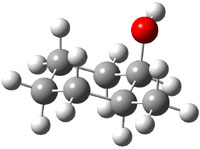
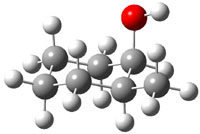
The approach they take was first to optimize the six different conformations for each diastereomer including solvent (chloroform). They chose to optimize the structures at B3LYP/6-311+G(2d,p) with PCM. The six conformers (notice the axial/equatorial relationships, along with the position of the alcohol hydrogen) of 1c are presented in Figure 1. Chemical shifts were then obtained with a number of different methods, weighting them according to a Boltzmann distribution.

0.0
xyz

0.20
xyz

0.73
xyz

1.23
xyz

1.56
xyz

1.85
xyz

Figure 1. PCM/B3LYP/6-311+G(2d,p) optimized structures of the conformers of 1c. Relative energies (kcal mol-1) are listed for each isomer.

Now a brief digression into how they developed their modified functional.2 They define the exchange-correlation functional (see Chapter 1.3.1 of my book – or many other computational chemistry books!) as

      Exc = P2Ex(HF) + P3ΔEx(B) + P4Ex(LSDA) + P5ΔEc(LYP) + P6Ec(LSDA)

where the Ps are parameters to be fit and Ex(HF) is the Hartree-Fock exchange energy, ΔEx(B) is the Becke gradient correction to the local spin-density approximation (LSDA), Ex(LSDA) is the exchange energy, ΔEc(LYP) is the Lee-Yang-Parr correction to the LSDA correlation energy, and Ec(LSDA) is the LSDA correlation energy. Chemical shifts were computed for proton and carbon, and the parameters P were adjusted (between 0 and 1) to minimize the error in the predicted chemical shifts from the experimental values. A total of 43 different molecules were used for this fitting procedure. The values of the parameters are given for the carbon functional (WC04), the proton functional (WP04) and B3LYP (as a reference) in Table 1. Note that there is substantial difference in the values of the parameter among these three different functionals.

Table 1. Values of the parameters P for the functionals WC04, WP04, and B3LYP.


P2

P3

P4

P5

P6


WC04

0.7400

0.9999

0.0001

0.0001

0.9999

WP04

0.1189

0.9614

0.999

0.0001

0.9999

B3LYP

0.20

0.72

0.80

0.81

1.00


Now, the computed proton and carbon chemical shifts using 4 different functions (B3LYP, PBE1, MP04, and WC04) for 1-3 were compared with the experiment values. This comparison was made in a number of different ways, but perhaps most compellingly by looking at the correlation coefficient of the computed shifts compared with the experimental shifts. This was done for each diastereomer, i.e. the computed shifts for 2c and 2t were compared with the experimental shifts of both 2c and 2t. If the functional works well, the correlation between the computed and experimental chemical shifts of 2c (and 2t) should be near unity, while the correlation between the computed shifts of 2c and the experimental shifts of 2t should be dramatically smaller than one. This is in fact the case for all three functionals. The results are shown in Table 2 for B3LYP and WP04, with the later performing slightly better. The results for the carbon shifts are less satisfactory; the correlation coefficients are roughly the same for all comparisons with B3LYP and PBE1, and WC04 is only slightly improved.
Nonetheless, the study clearly demonstrates the ability of DFT-computed proton chemical shifts to discriminate between diasteromers.

Table 2. Correlation coefficients between the computed and experimental proton chemical shifts.a


2ccomp
(1.06)
xyz

2tcomp
(0.0)
xyz


2cexp
 

2texp

0.9971
0.9985

0.8167
0.8098

0.8334
0.9050

0.9957
0.9843


3c
(0.0)
xyz

3t
(0.63)
xyz


3cexp
 

3texp

0.9950
0.9899

0.8856
0.9310

0.8763
0.8717

0.9990
0.9979


4c
(0.54)
xyz

4t
(0.0)
xyz


4cexp
 

4texp

0.9993
0.9975

0.8744
0.8675

0.8335
0.9279

0.9983
0.9938


aPCM/B3LYP/6-311+G(2d,p)//PCM/ B3LYP/6-31G(d) in regular type and PCM/WP04/6-311+G(2d,p)//PCM/ B3LYP/6-31G(d) in italic type. Relative energy (kcal mol-1) of the most favorable conformer of each diastereomer is given in parenthesis.

Predicting NMR of Natural Products

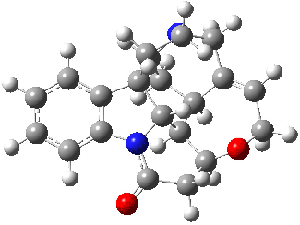
Bagno has a long-standing interest in ab initio prediction of NMR. In a recent article, his group takes on the prediction of a number of complex natural products.3 As a benchmark, they first calculated the NMR spectra of strychnine (4) and compare it with its experimental spectrum. The optimized PBE1PBE/6-31G(d,p) geometry of 4 is drawn in Figure 2. The correlation between the computed NMR chemical shifts for both 1H and 13C is quite good, as seen in Table 3. The corrected mean average errors are all very small, but Bagno does point out that four pairs of proton chemical shifts and three pairs of carbon chemical shifts are misordered.

Strychnine
4

Figure 2. PBE1PBE/6-31G(d,p) geometry of strychnine 4.3

Table 3. Correlation coefficient and corrected mean average error
(CMAE) between the computed and experiment chemical shifts of 4.


δ(1H)

δ(13C)

method

r2

CMAE

r2

CMAE

B3LYP/cc-pVTZ

0.9977

0.07

0.9979

1.4

PBE1PBE/cc-pVTZ

0.9974

0.08

0.9985

0.9


The study of the sesquiterpene carianlactone (5) demonstrates the importance of including solvent in the NMR computation. The optimized B3LYP/6-31G(d,p) geometry of 5 is shown in Figure 3, and the results of the comparison of the computed and experimental chemical are listed in Table 4. The correlation coefficient is unacceptable when the x-ray structure is used. The agreement improves when the gas phase optimized geometry is employed, but the coefficient is still too far from unity. However, optimization using PCM (with the solvent as pyridine to match experiments) and then computing the NMR chemical shifts in this reaction field provides quite acceptable agreement between the computed and experimental chemical shifts.

Corianlactone 5

Figure 3. B3LYP/6-31G(d,p) geometry of carianlactone 5.3

Table 4. Correlation coefficient and corrected mean average error (CMAE) between
the computed and experiment chemical shifts of 5.


δ(1H)

δ(13C)

geometry

r2

CMAE

r2

CMAE

X-ray

0.9268

0.23

0.9942

3.1

B3LYP/6-31G(d,p)

0.9513

0.19

0.9985

1.6

B3LYP/6-31G(d,p) + PCM

0.9805

0.11

0.9990

1.2


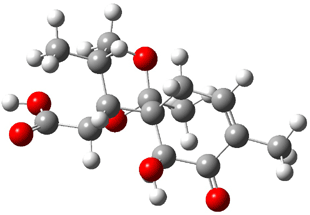
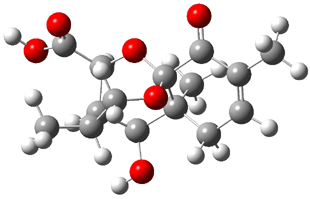
Lastly, Bagno took on the challenging structure of the natural product first identified as boletunone B (6a).4 Shortly thereafter, Steglich reinterpreted the spectrum and gave the compound the name isocyclocalopin A (6b).5 A key component of the revised structure was based on the δ 0.97 ppm signal that they assigned to a methyl above the enone group, noting that no methyl in 6a should have such a high field shift.

Bagno optimized the structures of 6a and 6b at B3LYP/6-31G(d,p), shown in Figure 4. The NMR spectra for 6a and 6b were computed with PCM (modeling DMSO as the solvent). The correlation coefficients and CMAE are much better for the 6b model than for the 6a model., supporting the reassigned structure. However, the computed chemical shift for the protons of the key methyl group in question are nearly identical in the two proposed structures: 1.08 ppm in 6a and 1.02 ppm in 6b. Nonetheless, the computed chemical shifts and coupling constants of 6b are a better fit with the experiment than those of 6a.

boletunone B 6a

isocyclocalopin A 6b

Figure 4. B3LYP/6-31G(d,p) geometry of the proposed structures of Boletunone B, 6a and 6b.3

Table 5. Correlation coefficient and corrected mean average error (CMAE) between the computed (B3LYP/6-31G(d,p) + PCM) and experiment chemical shifts of 6a and 6b.


δ(1H)

δ(13C)

structure

r2

CMAE

r2

CMAE

6a

0.9675

0.22

0.9952

3.7

6b

0.9844

0.15

0.9984

1.9


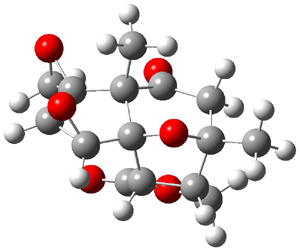
In a similar vein, Nicolaou and Frederick has examined the somewhat controversial structure of maitotxin.6 For the sake of brevity, I will not draw out the structure of maitotxin; the interested reader should check out its entry in wikipedia. The structure of maitotoxin has been extensively studied, but in 2006, Gallimore and Spencer7 questioned the stereochemistry of the J/K ring juncture. A fragment of maitotoxin that has the previously proposed stetreochemistry is 7. Gallimore and Spencer argued for a reversed stereochemistry at this juncture (8), one that would be more consistent with the biochemical synthesis of the maitotoxin. Nicolaou noted that reversing this stereochemistry would lead to other stereochemical changes in order for the structure to be consistent with the NMR spectrum. Their alternative is given as 9.

7

8

9

Nicolaou and Freferick computed 13C NMR of the three proposed fragments 7-9 at B3LYP/6-31G*; unfortunately they do not provide the coordinates. They benchmark this method against brevetoxin B, where the average error is 1.24 ppm, but they provide no error analysis – particularly no regression so that corrected chemical shift data might be employed. The best agreement between the computed and experimental chemical shifts is for 7, with average difference of 2.01 ppm. The differences are 2.85 ppm for 8 and 2.42 ppm for 9. These computations support the original structure of maitotoxin. The Curious Wavefunction blog discusses this topic, with an emphasis on the possible biochemical implication.

References

(1) Wiitala, K. W.; Al-Rashid, Z. F.; Dvornikovs, V.; Hoye, T. R.; Cramer, C. J., "Evaluation of Various DFT Protocols for Computing 1H and 13C Chemical Shifts to Distinguish Stereoisomers: Diastereomeric 2-, 3-, and 4-Methylcyclohexanols as a Test Set," J. Phys. Org. Chem. 2007, 20, 345-354, DOI: 10.1002/poc.1151

(2) Wiitala, K. W.; Hoye, T. R.; Cramer, C. J., "Hybrid Density Functional Methods Empirically Optimized for the Computation of 13C and 1H Chemical Shifts in Chloroform Solution," J. Chem. Theory Comput. 2006, 2, 1085-1092, DOI: 10.1021/ct6001016

(3) Bagno, A.; Rastrelli, F.; Saielli, G., "Toward the Complete Prediction of the 1H and 13C NMR Spectra of Complex Organic Molecules by DFT Methods: Application to Natural Substances," Chem. Eur. J. 2006, 12, 5514-5525, DOI: 10.1002/chem.200501583

(4) Kim, W. G.; Kim, J. W.; Ryoo, I. J.; Kim, J. P.; Kim, Y. H.; Yoo, I. D., "Boletunones A and B, Highly Functionalized Novel Sesquiterpenes from Boletus calopus," Org. Lett. 2004, 6, 823-826, DOI: 10.1021/ol049953i

(5) Steglich, W.; Hellwig, V., "Revision of the Structures Assigned to the Fungal Metabolites Boletunones A and B," Org. Lett. 2004, 6, 3175-3177, DOI: 10.1021/ol048724t.

(6) Nicolaou, K. C.; Frederick, M. O., "On the Structure of Maitotoxin," Angew. Chem. Int. Ed., 2007, 46, 5278-5282, DOI: 10.1002/anie.200604656.

(7) Gallimore, A. R.; Spencer, J. B., "Stereochemical Uniformity in Marine Polyether Ladders – Implications for the Biosynthesis and Structure of Maitotoxin," Angew. Chem. Int. Ed. 2006, 45, 4406-4413, DOI: 10.1002/anie.200504284.

InChI

1: InChI=1/C7H14O/c1-6-4-2-3-5-7(6)8/h6-8H,2-5H2,1H3
2: InChI=1/C7H14O/c1-6-3-2-4-7(8)5-6/h6-8H,2-5H2,1H3
3: InChI=1/C7H14O/c1-6-2-4-7(8)5-3-6/h6-8H,2-5H2,1H3
4: InChI=1/C21H22N2O2/c24-18-10-16-19-13-9-17-21(6-7-22(17)11-12(13)5-8-25-16)14-3-1-2-4-15(14)23(18)20(19)21/h1-5,13,16-17,19-20H,6-11H
5: InChI=1/C14H14O6/c1-12-2-6(15)8-13(4-18-13)9-10(19-9)14(8,20-12)7-5(12)3-17-11(7)16/h5,7-10H,2-4H2,1H3/t5-,7-,8?,9+,10+,12+,13?,14-/m1/s1
6a: InChI=1/C15H20O6/c1-7-4-5-14(3)12(17)9-8(2)6-20-15(14,11(7)16)21-10(9)13(18)19/h4,8-10,12,17H,5-6H2,1-3H3,(H,18,19)/t8-,9+,10+,12+,14-,15-/m1/s1
6b: InChI=1/C15H20O6/c1-7-4-5-15(12(17)10(7)16)9-8(2)6-20-14(15,3)21-11(9)13(18)19/h4,8-9,11-12,17H,5-6H2,1-3H3,(H,18,19)/t8?,9-,11?,12+,14-,15-/m1/s1

Cramer &DFT &NMR Steven Bachrach 01 Aug 2007 1 Comment

Branching on the Diels-Alder Potential Energy Surface

The search for unusual potential energy surface topologies continues. Unusual surfaces can lead to dynamic effects that result in rates and product distributions dramatically divergent from that predicted by statistical theories. I addressed this topic in Chapter 7 of the book.

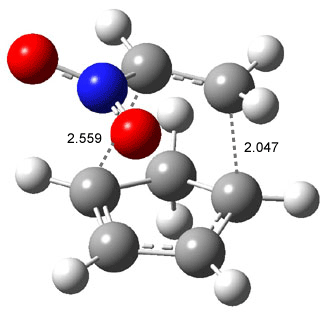
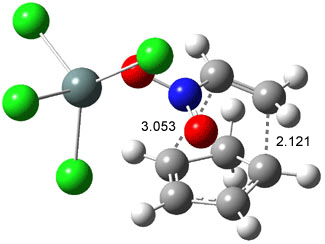
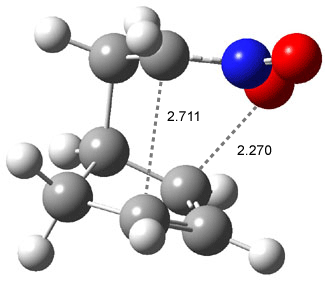
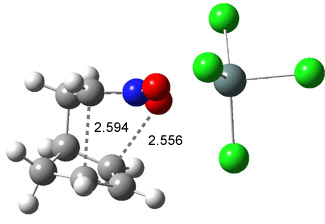
Houk has found another interesting example in the Diels-Alder reaction of cyclopentadiene with nitrostyrene 1.1 The [4+2] adduct is 2, which can undergo a [3,3] Cope-like rearrangement to give 3. Product 3 can also result from a [2+4] Diels-Alder cycloaddition where cyclopentadiene acts as the dienophile.

Like some of the examples in Chapter 7, the potential energy surface, computed at B3LYP/6-31+G*, contains a single transition state (TS1) from reactants. Continuing on the reaction path past the transition state, a valley ridge inflection point (VRI) intervenes, causing the path to bifurcate: one path leads to 2 and the other leads to 3. In other words, a single transition state leads to two different products! TS1 is geometrically closer to 2 than 3, while TS2 lies closer to 3 than 2 (Figure 1). This topology directs most molecules to traverse a path over TS1 and on to 2. What is novel in this paper is that the acid-catalyzed reaction, using SnCl4, shifts TS1 towards 3 and TS2 towards 2, leading to the opposite product distribution. The uncatalyzed reaction favors formation of 2 while the catalyzed reaction favors 3 over 2. Confirmation of this prediction awaits a molecular dynamics study.

TS1

TS1-Cat

TS2

TS2-Cat

Figure 1. B3LYP/6-31+G(d) optimized structures for TS1 and TS2.1

References

(1) Celebi-Olcum, N.; Ess, D. H.; Aviyente, V.; Houk, K. N., “Lewis Acid Catalysis Alters the Shapes and Products of Bis-Pericyclic Diels-Alder Transition States,” J. Am. Chem. Soc., 2007, 129, 4528-4529. DOI: 10.1021/ja070686w

InChI

1: InChI=1/C8H7NO2/c10-9(11)7-6-8-4-2-1-3-5-8/h1-7H/b7-6+
2: InChI=1/C13H13NO2/c15-14(16)13-11-7-6-10(8-11)12(13)9-4-2-1-3-5-9/h1-7,10-13H,8H2
3: InChI=1/C13H13NO2/c15-14-9-12(10-5-2-1-3-6-10)11-7-4-8-13(11)16-14/h1-6,8-9,11-13H,7H2

DFT &Diels-Alder &Houk Steven Bachrach 30 Jul 2007 No Comments

Antiaromatic but Isolable

In the pursuit of further elucidation of just what the concepts “aromatic” and “antiaromatic” mean, Schleyer and Bunz reported the preparation and characterization of a novel antiaromatic compound that is isolable.1

Bunz synthesized the redox pair of compounds 1 and 2 that differ in the electron count in the pi-system. The former (1) has 14 π electrons and should be aromatic, while the latter (5) has 16 π electrons and should be antiaromatic. The NMR spectrum of both compounds was measured and compared to the computed signals of the parent compounds 3 and 4. The signals match very nicely. The structures of 1 and 2 were further confirmed by x-ray crystallography. 1 and 2 can be interconverted by redox reactions and 2 is stable in air, only slowly oxidizing to 1.

The NICS(0)πizz values computed for 3 and 4 are shown in Figure 1. (See ref 2 for a discussion on this NICS method and also Chapter 2 of my book.) These values are quite negative for each ring of 3, consistent with its expected aromatic character. On the other hand, the NICS value for each ring of 4 is more positive than the corresponding ring of 3, with the value in the center of the pyrazine ring being positive. These NICS values indicate that 4 is certainly less aromatic than 3, and perhaps even expresses antiaromatic character.

Figure 1. NICS(0)πzz values for 3 and 4 computed at PW91/6-311G**.

Interestingly, hydrogenation of 3 to give 4 is -14.0, indicating that while 3 appears to be a normal aromatic compound, 4, if it is antiaromatic, exhibits some energetic stabilization. They identify this stabilization as a result of the interaction between the dihydropyrazine ring and the thidiazole ring, evidenced in the exothermicity of the isodemic reaction:

So while 4 may be antiaromatic, it appears to be energetically reasonably stable. It is important to keep in mind though that 4 is not the most stable tricycle isomer; in fact, 5 is 7 kcal mol-1 lower in energy than 4.

Schleyer and Bunz conclude that antiaromaticity may “not result in a prohibitive energetic penalty.”

References

(1) Miao, S.; Schleyer, P. v. R.; Wu, J. I.; Hardcastle, K. I.; Bunz, U. H. F., "A Thiadiazole-Fused N,N-Dihydroquinoxaline: Antiaromatic but Isolable," Org. Lett. 2007, 9, 1073-1076, DOI: 10.1021/ol070013i

(2) Fallah-Bagher-Shaidaei, H.; Wannere, C. S.; Corminboeuf, C.; Puchta, R.; Schleyer, P. v. R., "Which NICS Aromaticity Index for Planar π Rings Is Best?," Org. Lett., 2006, 8, 863-866, DOI: 10.1021/ol0529546.

InChI

3: InChI=1/C8H4N4S/c1-2-10-6-4-8-7(11-13-12-8)3-5(6)9-1/h1-4H
4: InChI=1/C8H6N4S/c1-2-10-6-4-8-7(11-13-12-8)3-5(6)9-1/h1-4,9-10H
5: InChI=1/C8H6N4S/c1-2-10-6-4-8-7(11-13-12-8)3-5(6)9-1/h1-2H,3-4H2

Aromaticity &DFT &polycyclic aromatics &Schleyer Steven Bachrach 25 Jul 2007 2 Comments

Cope Rearrangement vs. Tandem Retro-Diels-Alder-Diels-Alder Reaction

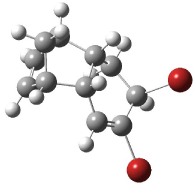
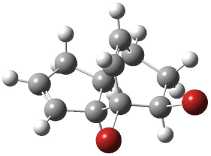
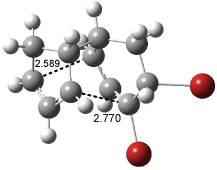
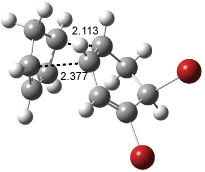
Here as an interesting, relatively straightforward example of how modern computational methods can help elucidate a reaction mechanism. Brinker1 examined the thermolysis of (1S,2R,5R,7S,8R)-4,5-dibromotricyclo[6.2.1.02,7]undeca-3,9-diene 1. The observed products were cyclopentadiene (and its dimer), bromobenzene and (1R,2S,6S,7R,10R)-1,10-dibromotricyclo[5.2.2.02,6]undeca-3,8-diene
2. They proposed two possible mechanisms to account for these products. In the first mechanism, 1 can convert to 2 via a Cope rearrangement (path a, Scheme 1). The alternative mechanism has 1 undergo a retro-Diels-Alder reaction to produce 1,6-dibromo-1,3-cyclohexadiene 3 and cyclopentadiene 4 (path b, Scheme 1) 3 can then lose HBR to give bromobenzene. But more interesting is the possibility that cyclopentadiene and 3 can undergo a Diels-Alder reaction (path c, Scheme 1), but one with role reversal, i.e. cylopentadiene acts as the dienophile here, rather than the diene component as in the reverse of path b. This second Diels-Alder reaction (path c) produces 2.

Scheme 1

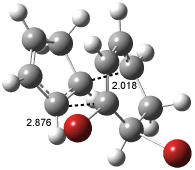
Brinker optimized the structures in Scheme 1, along with the transition states from paths a-c, at B3LYP/6-31G(d). These structures are shown in Figure 1 and their relative energies are listed in Table 1. The Cope rearrangement is favored over the retro-Diels-Alder by 3.6 kcal mol-1. While the subsequent Diels-Alder step (path c) has a low electronic barrier (21.7 kcal mol-1), it is enthalpically disfavored and the free energy barrier is high (40.4 kcal mol-1. Thus, formation of 2 derives mostly from the direct Cope rearrangement of 2. Production of bromobenzene from 2 results from the retro-Diels-Alder (path b) followed by loss of HBr.

Table 1. Electronic and Free Energies (kcal mol-1­) computed at B3LYP/6-31G(d).1


ΔE ΔG412

1 0.0 0.0
TS(a) +30.4 +30.6
2 -7.9 -7.3
TS(b) +36.0 +34.2
3 + 4 +10.9 -8.4
TS(c) +33.7 +32.0

brinker 1

1
xyz file

brinker 2

2
xyz files

brinker TSa

TS(a)
xyz files

brinker TSb

TS(b)
xyz file

brinker TSc

TS(c)
xyz file

Figure 1. B3LYP/6-31G(d) optimized structures.1

InChI:

1: InChI=1/C11H12Br2/c12-10-4-8-6-1-2-7(3-6)9(8)5-11(10)13/h1-2,4,6-9,11H,3,5H2/t6-,7+,8-,9+,11-/m1/s1

2: InChI=1/C11H12Br2/c12-10-6-7-4-5-11(10,13)9-3-1-2-8(7)9/h1,3-5,7-10H,2,6H2/t7-,8+,9+,10+,11+/m0/s1
References

(1) Su, K. J.; Mieusset, J. L.; Arion, V. B.; Brecker, L.; Brinker, U. H., “Cope Rearrangement versus a Novel Tandem Retro-Diels-Alder-Diels-Alder Reaction with Role reversal,” Org. Lett. 2007, 9, 113-115, DOI: 10.1021/ol0626793

Cope Rearrangement &DFT &Diels-Alder Steven Bachrach 23 Jul 2007 No Comments

Hypercoordinate Carbon

The search for a stable molecule containing a hypercoordinated carbon atom may finally be over. Abboud and Yáñez1 report mass spectra and computations on the unusual cation Si(CH3)3CH3Si(CH3)3+ (1). Using low pressure FT-ICR, upon ionization of Si(CH3)4 (TMS) they observe a small signal with m/z 161.12, which corresponds to the mass of 1+. When Si(CH3)4 and Si(CD3)4 are mixed, introduced into the spectrometer and ionized, the mixed isotopomer of 1+ is observed, and scrambling to the CH3 and CD3 groups occurs.

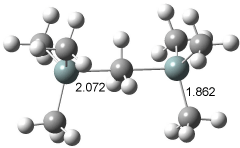
The geometry of 1+ was optimized at B3LYP/6-311+G(3df,2pd) and QCISD/6-311+G(d,p). The latter structure is shown in Figure 1, though the geometry differs little between the two computations. The enthalpy for the dissociation of 1+ into TMS and Si(CH3)3+ is 23.2 kcal mol-1 at QCISD. This compares very well with the experimental2 value of 22.3 kcal mol-1.

cmpd 1

xyz file

Figure 1. QCISD/6-311+G(d,p) optimized structure of 1+.1

The structure has C3h symmetry with the central carbon to silicon distance of 2.071 Å, a bit more than a 10% increase over the length of a typical C-Si bond. Topological electron density analysis indicates a bond critical point does connect the central carbon atom with each silicon atom, and the value of the Laplacian of the electron density at this critical point is negative. This analysis strongly suggests that the central carbon atom is pentacoordinate!

Abboud and Yáñez argue that 1+ can be considered as a complex of methyl cation and two Si(CH3)3 radicals. The empty p orbital of the central methyl carbon can then interact with the radical-bearing orbital on each silicon, forming a three-center two-electron bonding molecular orbital (Scheme 1). The positive charge is delocalized, with the central methyl group having a charge of +0.26 while the charge on each Si(CH3)3 groups is +0.37.

Scheme 1.

Though not discussed in this paper, the all carbon analogue, namely C(CH3)3CH3C(CH3)3+
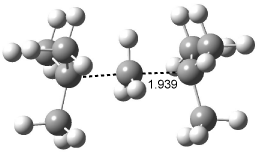
is not a stable structure when restricted to have C3h symmetry (see Figure 2). Rather, this geometry corresponds to the transition state for the transfer of a methyl group from one C(CH3)3 group to the other.

cmpd 2

xyz files

Figure 1. B3LYP/6-311+G(d,p) optimized geometry of C(CH3)3CH3C(CH3)3+.

References

(1) Daacute;valos, J. Z.; Herrero, R.; Abboud, J.-L. M.; Mó, O.; Yáñez, M., "How Can a Carbon Atom Be Covalently Bound to Five Ligands? The Case of Si2(CH3)7+," Angew. Chem. Int. Ed. 2007, 46, 381-385, DOI: 10.1002/anie.200601164

(2) Wojtyniak, A. C. M.; Li, X.; Stone, J. A., "The Formation of CH3)7Si2+ in (CH3)4Si/CH4 Mixtures and CH3−Exchange Reactions between (CH3)4Si, (CH3)4Ge, and (CH3)4Sn Studied by High Pressure Mass Spectrometry," Can. J. Chem. 1987, 65, 2849-2854,

DFT Steven Bachrach 20 Jul 2007 No Comments

« Previous PageNext Page »