Structure of 2-oxazoline

MP &vibrational frequencies Steven Bachrach 15 Jun 2015 1 Comment

A recent reinvestigation of the structure of 2-oxazoline demonstrates the difficulties that many computational methods can still have in predicting structure.

Samdal, et al. report the careful examination of the microwave spectrum of 2-oxzoline and find that the molecule is puckered in the ground state.1 It’s not puckered by much, and the barrier for inversion of the pucker, through a planar transition state is only 49 ± 8 J mol-1. The lowest vibrational frequency in the non-planar ground state, which corresponds to the puckering vibration, has a frequency of 92 ± 15 cm-1. This low barrier is a great test case for quantum mechanical methodologies.

And the outcome here is not particularly good. HF/cc-pVQZ, M06-2X/cc-pVQZ, and B3LYP/cc-pVQZ all predict that 2-oxazoline is planar. More concerning is that CCSD and CCSD(T) with either the cc-pVTZ or cc-pVQZ basis sets also predict a planar structure. CCSD(T)-F12 with the cc-pVDZ predicts a non-planar ground state with a barrier of only 8.5 J mol-1, but this barrier shrinks to 5.5 J mol-1 with the larger cc-pVTZ basis set.

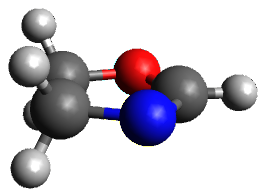
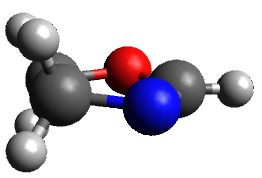
The only method that has good agreement with experiment is MP2. This method predicts a non-planar ground state with a pucker barrier of 11 J mol-1 with cc-pVTZ, 39.6 J mol-1 with cc-pVQZ, and 61 J mol-1 with the cc-pV5Z basis set. The non-planar ground state and the planar transition state of 2-oxazoline are shown in Figure 1. The computed puckering vibrational frequency does not reproduce the experiment as well; at MP2/cc-pV5Z the predicted frequency is 61 cm-1 which lies outside of the error range of the experimental value.

Non-planar

Planar TS

Figure 1. MP2/cc-pV5Z optimized geometry of the non-planar ground state and the planar transition
state of 2-oxazoline.

References

(1) Samdal, S.; Møllendal, H.; Reine, S.; Guillemin, J.-C. "Ring Planarity Problem of 2-Oxazoline Revisited Using Microwave Spectroscopy and Quantum Chemical Calculations," J. Phys. Chem. A 2015, 119, 4875–4884, DOI: 10.1021/acs.jpca.5b02528.

InChIs

2-oxazoline: InChI=1S/C3H5NO/c1-2-5-3-4-1/h3H,1-2H2
InChIKey=IMSODMZESSGVBE-UHFFFAOYSA-N
Making superacidic phenols

Acidity &Kass Steven Bachrach 02 Jun 2015 No Comments

Kass and coworkers looked at a series of substituted phenols to tease out ways to produce stronger acids in non-polar media.1 First they established a linear relationship between the vibrational frequency shifts of the hydroxyl group in going from CCl4 as solvent to CCl4 doped with 1% acetonitrile with the experimental pKa in DMSO. They also showed a strong relationship between this vibrational frequency shift and gas phase acidity (both experimental and computed deprotonation energies).

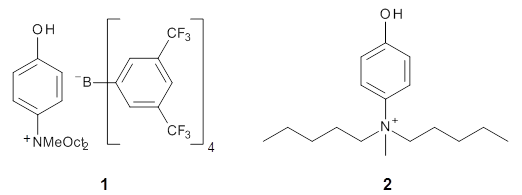
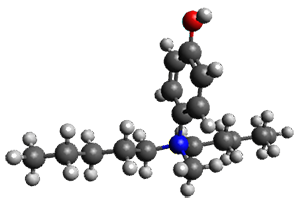
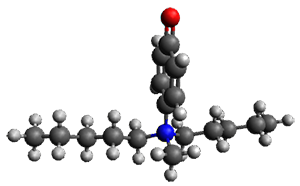
A key recognition was that a charged substituent (like say ammonium) has a much larger effect on the gas-phase (and non-polar solvent) acidity than on the acidity in a polar solvent, like DMSO. This can be attributed to the lack of a medium able to stable charge build-up in non-polar solvent or in the gas phase. This led them to 1, for which B3LYP/6-31+G(d,p) computations of the analogous dipentyl derivative 2 (see Figure 1) indicated a deprotonation free energy of 261.4 kcal mol-1, nearly 60 kcal mol-1 smaller than any other substituted phenol they previously examined. Subsequent measurement of the OH vibrational frequency shift showed the largest shift, indicating that 1 is extremely acidic in non-polar solvent.

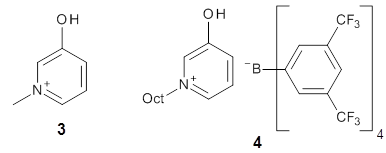
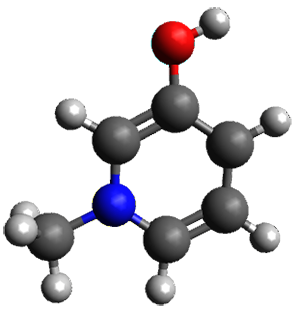
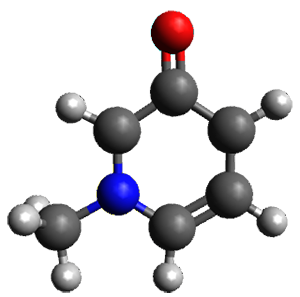
Further computational exploration led to 3 (see Figure 1), for which computations predicted an even smaller deprotonation energy of 231.1 kcal mol-1. Preparation of 4 and experimental observation of its vibrational frequency shift revealed an even larger shift than for 1, making 4 extraordinarily acidic.

2

Conjugate base of 2


3


Conjugate base of 3

Figure 1. B3LYP/6-31+G(d,p) optimized geometries of 2 and 3 and their conjugate bases.

Reference

(1) Samet, M.; Buhle, J.; Zhou, Y.; Kass, S. R. "Charge-Enhanced Acidity and Catalyst Activation," J. Am. Chem. Soc. 2015, 137, 4678-4680, DOI: 10.1021/jacs.5b01805.

InChI

1 (cation only): InChI=1S/C23H41NO/c1-4-6-8-10-12-14-20-24(3,21-15-13-11-9-7-5-2)22-16-18-23(25)19-17-22/h16-19H,4-15,20-21H2,1-3H3/p+1
InChIKey=HIQMXPFMEWRQQG-UHFFFAOYSA-O

2: InChIKey=WMOPRSHYZNVZKF-UHFFFAOYSA-O

3: InChI=1S/C6H7NO/c1-7-4-2-3-6(8)5-7/h2-5H,1H3/p+1
InChIKey=FZVAZYLFYPULKX-UHFFFAOYSA-O

4 (cation only): InChI=1S/C13H21NO/c1-2-3-4-5-6-7-10-14-11-8-9-13(15)12-14/h8-9,11-12H,2-7,10H2,1H3/p+1
InChIKey=HSFRKOBOATYXAH-UHFFFAOYSA-O

Host-guest complexes

Grimme &host-guest Steven Bachrach 12 May 2015 1 Comment

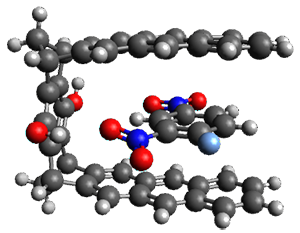
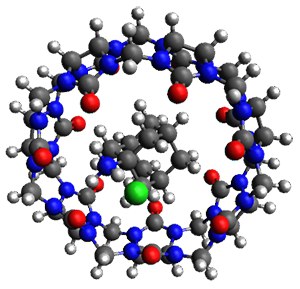
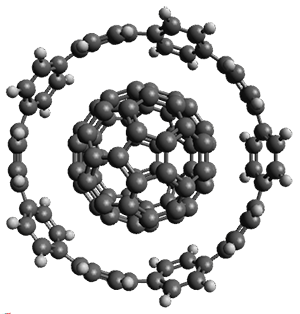
Grimme and coworkers have a featured article on computing host-guest complexes in a recent ChemComm.1 They review the techniques his group has pioneered, particularly dispersion corrections for DFT and ways to treat the thermodynamics in moving from electronic energy to free energy. they briefly review some studies done by other groups. They conclude with a new study of eight different host guest complexes, three of which are shown in Figure 1.

1

2

3

Figure 1. TPSS-D3(BJ)/def2-TZVP optimized structures of 1-3.

These eight host-guest complexes are fairly large systems, and the computational method employed means some fairly long computations. Geometries were optimized at TPSS-D3(BJ)/def2-TZVP, then single point energy determined at PW6B95-D3(BJ)/def2-QZVP. Solvent was included using COSMO-RS. The curcurbituril complex 2 includes a counterion (chloride) along with the guest adamantan-1-aminium. Overall agreement of the computed free energy of binding with the experimental values was very good, except for 3 and the related complex having a larger nanohoop around the fullerene. The error is due to problems in treating the solvent effect, which remains an area of real computational need.

An interesting result uncovered is that the binding energy due to dispersion is greater than the non-dispersion energy for all of these complexes, including the examples that are charged or where hydrogen bonding may be playing a role in the bonding. This points to the absolute necessity of including a dispersion correction when treating a host-guest complex with DFT.

As an aside, you’ll note one of the reasons I was interested in this paper: 3 is closely related to the structure that graces the cover of the second edition of my book.

References

(1) Antony, J.; Sure, R.; Grimme, S. "Using dispersion-corrected density functional theory to understand supramolecular binding thermodynamics," Chem. Commun. 2015, 51, 1764-1774, DOI: 10.1039/C4CC06722C.

Uthrene, the smallest diradical graphene fragment

Aromaticity Steven Bachrach 04 May 2015 1 Comment

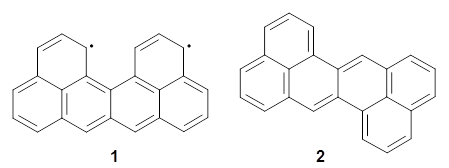
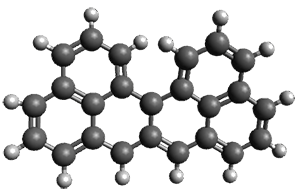
Uthrene 1 is the smallest formally diradical fragment of graphene; it cannot be expressed in a closed shell, fully electron-paired Kekule form. Its isomer zethrene 2 on the other hand, can be expressed in closed shell form.

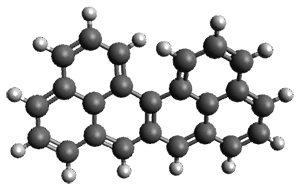
Melle-Franco has examined these, and related, polycyclic aromatic hydrocarbons with DFT.1 The optimized structure of singlet and triplet 1 at CAM-B3LYP/6-31g(d,p) are shown in Figure 1. The singlet-triplet energy gap of 2 is 16.5 kcal mol-1 with a ground state singlet. However, for 1 the triplet is predicted to be lower in energy than the singlet by 7.7 kcal mol-1. And this gap increases to 10.9 kcal mol-1 at CASSCF(14,14)/6-31g(d,p)//CAM-B3LYP/6-31g(d,p). Natural orbital population analysis of the singlet of 1 at CASSCF identifies two orbitals with populations around 1 e.

Interestingly, both the singlet and triplet of 1 are not planar, exhibiting a twist to avoid the clashing of the hydrogens in the bay region. (This twisting is best seen by clicking on the structures in Figure 1, and viewing the molecules interactively through Jmol.)

singlet

triplet

Figure 1. CAM-B3LYP/6-31g(d,p) optimized geometries of the singlet and triplet of 1.

References

(1) Melle-Franco, M. "Uthrene, a radically new molecule?," Chem. Commun. 2015, 51, 5387-5390, DOI: 10.1039/C5CC01276G.

InChIs

1: InChI=1S/C24H14/c1-5-15-7-3-11-20-22(15)17(9-1)13-19-14-18-10-2-6-16-8-4-12-21(23(16)18)24(19)20/h1-14H
InChIKey=WAKUAPLTIMTENF-UHFFFAOYSA-N
2: InChI=1S/C24H14/c1-5-15-7-3-11-19-22-14-18-10-2-6-16-8-4-12-20(24(16)18)21(22)13-17(9-1)23(15)19/h1-14H
InChIKey=UXUXNGMSDNTZEC-UHFFFAOYSA-N
Fluorenyl cation

Aromaticity Steven Bachrach 13 Apr 2015 1 Comment

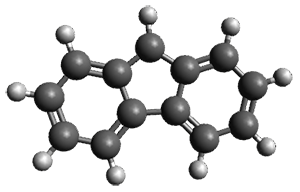
Is the fluorenyl cation 1 antiaromatic or non-aromatic? This is still an open question. But the recent paper by Costa, et al. provides a new path towards potentially answering this question; they have finally synthesized this molecule.1

By photolizing 2 in low-density amorphous ice (LDA ice) and in deuterated ice at 8 K, they have identified a new IR spectrum.

To identify the origin of these spectra, they optimized the geometry of the fluorenyl cation 1 at B3LYP-D3/def2-TZVP (see Figure 1) and computed its IR spectra. These computed IR frequencies were then scaled by 0.97. The agreement between the computed and experimental frequencies is quite reasonable, and the isotopic shifts are also reasonably well reproduced. The agreement is not perfect, as seen in Table 1. Hopefully, further experiments will now be carried out to try to answer the lead question of this post.

Figure 1. B3LYP-D3/def2-TZVP optimized geometry of 1.

Table 1. Experimental and computed IR frequencies (cm-1)
and isotopic shift (in parentheses) of 1.

Calc.

Exp.

1008.8

986

1106.8 (+2.1)

1076.8 (+1.7)

1152.8

1117.2

1198.6

1163.5

1267.0

1235.1

1373.4 (-16.4)

1343.7

1510.8(-8.3)

1469.0 (-7.3)

1530.7 (-3.2)

1490.5 (-1.0)

1616.8(-6.4)

1575.7(-4.4)

1640.9 (0.0)

1601.2 (-4.0)

References

(1) Costa, P.; Trosien, I.; Fernandez-Oliva, M.; Sanchez-Garcia, E.; Sander, W. "The Fluorenyl Cation," Angew. Chem. Int. Ed. 2015, 54, 2656-2660, DOI: 10.1002/anie.201411234.

InChIs

1: InChI=1S/C13H9/c1-3-7-12-10(5-1)9-11-6-2-4-8-13(11)12/h1-9H/q+1
InChIKey=KZCNYQVQQBONEY-UHFFFAOYSA-N

Gas phase structure of uridine

MP &nucleic acids Steven Bachrach 06 Apr 2015 No Comments

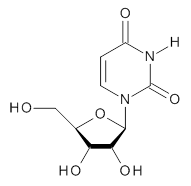
To advance our understanding of why ribose takes on the furanose form, rather than the pyranose form, in RNA, Alonso and co-workers have examined the structure of uridine 1 in the gas phase.1


1

Uridine is sensitive to temperature, and so the laser-ablation method long used by the Alonso group is ideal for examining uridine. The microwave spectrum is quite complicated due to the presence of many photofragments. Careful analysis lead to the identification of a number of lines and hyperfine structure that could be definitively assigned to uridine, leading to experimental values of the rotational constants and the diagonal elements of the 14N nuclear quadrupole coupling tensor for each nitrogen. These values are listed in Table 1.

Table 1. Experimental and calculated rotational constants (MHz), quadrupole coupling constants (MHz) and relative energy (kcal mol-1).


calculated


Expt.

anti/C2’-endo-g+

syn/C2’-endo-g+

anti/C3’-endo-g+

anti/C2’-endo-t

syn/C3’-endo-g+

A

885.98961

901.2

935.8

790.0

799.7

925.5

B

335.59622

340.6

308.4

352.6

330.6

300.4

C

270.11210

276.6

266.6

261.4

262.9

264.0

14N1 χxx

1.540

1.50

1.82

1.48

1.46

1.82

14N1 χyy

1.456

1.43

0.73

1.71

1.81

-0.72

14N1 χzz

-2.996

-2.93

-2.56

-3.19

-3.27

-1.11

14N3 χxx

1.719

1.74

2.03

1.78

1.62

1.98

14N3 χyy

1.261

1.11

0.47

1.34

1.51

-0.75

14N3 χzz

-2.979

-2.85

-2.50

-3.12

-3.13

-1.23

Rel E


0.0

1.10

1.90

2.00

2.15

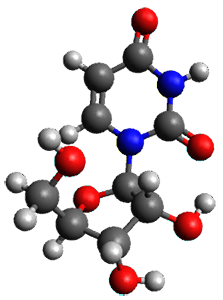
In order to assign a 3-D structure to these experimental values, they examined the PES of uridine with molecular mechanics and semi-empirical methods, before reoptimizing the structure of the lowest 5 energy structures at MP2/6-311++G(d,p). Then, comparison of the resulting rotational constants and 14N nuclear quadrupole coupling constants of these computed structures (see Table 1) led to identification of the lowest energy structure (anti/C2’-endo-g+, see Figure 1) in best agreement with the experiment. Once again, the Alonso group has demonstrated the value of the synergy between experiment and computation in structure identification.

Figure 1. MP2/6-311++G(d,p) optimized structure of 1 (anti/C2’-endo-g+).

References

(1) Peña, I.; Cabezas, C.; Alonso, J. L. "The Nucleoside Uridine Isolated in the Gas Phase," Angew. Chem. Int. Ed. 2015, 54, 2991-2994, DOI: 10.1002/anie.201412460.

Inchis:

1: Inchi=1S/C9H12N2O6/c12-3-4-6(14)7(15)8(17-4)11-2-1-5(13)10-9(11)16/h1-2,4,6-8,12,14-15H,3H2,(H,10,13,16)/t4-,6-,7-,8-/m1/s1
InChiKey=DRTQHJPVMGBUCF-XVFCMESISA-N

Molecular rotor and C-Hπ interaction

Aromaticity &Houk &Hydrogen bond Steven Bachrach 23 Mar 2015 No Comments

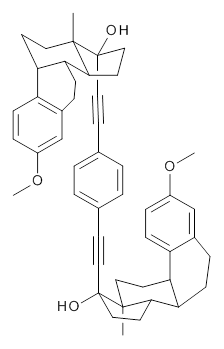
Molecular rotors remain a fascinating topic – the idea of creating a miniature motor just seems to capture the imagination of scientists. Garcia-Garibay and his group have synthesized the interesting rotor 1, and in collaboration with the Houk group, they have utilized computations to help understand the dynamics of this rotor.1


1

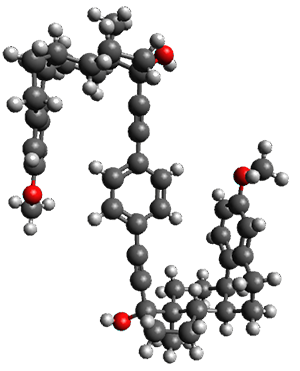
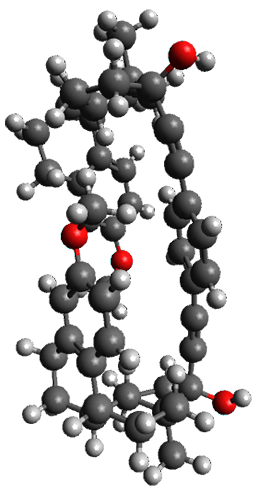
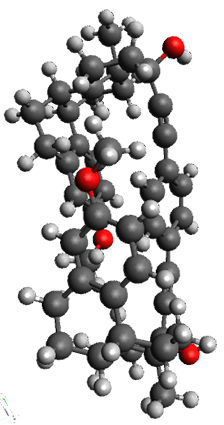
The x-ray structure of this compound, shown in Figure 1, displays two close interactions of a hydrogen on the central phenyl ring with the face of one of the steroidal phenyl rings. Rotation of the central phenyl ring is expected to then “turn off” one or both of these C-Hπ interactions. The authors argue this as a competition between the molecule sampling an enthalpic region, where the molecule has one or two favorable C-Hπ interactions, and the large entropic region where these C-Hπ interactions do not occur, but this space is expected to have a large quantity of energetically similar conformations.

x-ray

1a

1b

Figure 1. X-ray and M06-2x/6-31G(d) optimized structures of 1.

Variable temperature NMR finds the central phenyl hydrogen with a chemical shift of 6.55ppm at 295 K but at 6.32 ppm at 222 K. This suggest as freezing of the conformations at low temperature favoring those conformations possessing the internal C-Hπ interactions. M06-2X/6-31G(d) optimization finds two low-energy conformations with a single C-Hπ interaction. These are shown in Figure 1. No competing conformation was found to have two such interactions. Computations of the chemical shifts of these conformations show the upfield shift of the central phenyl hydrogens. Fitting these chemical shifts to the temperature data gives ΔH = -1.74 kcal mol-1, ΔS = -5.12 esu and ΔG = -0.21 kcal mol-1 for the enthalpic region to entropic region transition.

References

(1) Pérez-Estrada, S.; Rodrı́guez-Molina, B.; Xiao, L.; Santillan, R.; Jiménez-Osés, G.; Houk, K. N.; Garcia-Garibay, M. A. "Thermodynamic Evaluation of Aromatic CH/π Interactions and Rotational Entropy in a Molecular Rotor," J. Am. Chem. Soc. 2015, 137, 2175-2178, DOI: 10.1021/ja512053t.

InChIs

1: InChI=1S/C48H54O4/c1-45-23-19-39-37-15-11-35(51-3)29-33(37)9-13-41(39)43(45)21-27-47(45,49)25-17-31-5-7-32(8-6-31)18-26-48(50)28-22-44-42-14-10-34-30-36(52-4)12-16-38(34)40(42)20-24-46(44,48)2/h5-8,11-12,15-16,29-30,39-44,49-50H,9-10,13-14,19-24,27-28H2,1-4H3
InChIKey=CXZHCTLIHKZRMW-UHFFFAOYSA-N
Structure revision: Vescalagin and Castalagin

NMR Steven Bachrach 09 Mar 2015 No Comments

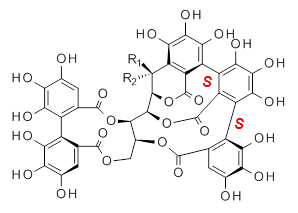
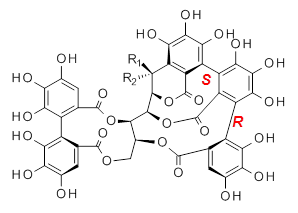
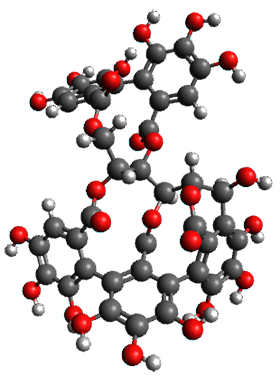
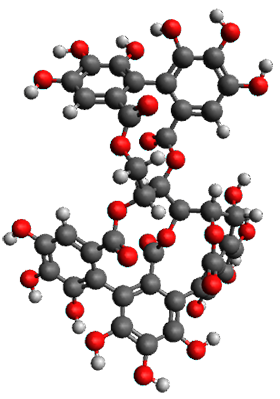
Vescalagin 1 and castalagin 2 are found in plants and also in wine and whisky. They possess some intriguing stereochemistry and the topic of interest in the paper by Tanaka and coworkers is the stereochemistry of the triphenyl fragment.1 The original proposed structure indicated a (S,S) (1a and 2a) configuration, yet a molecular mechanics study suggest the (S,R) (1b and 2b) configuration would be lower in energy.

1a: R1 = OH, R2 = H
2a: R1 = H, R2 = OH

1b: R1 = OH, R2 = H
2b: R1 = H, R2 = OH

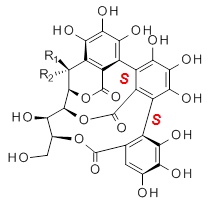
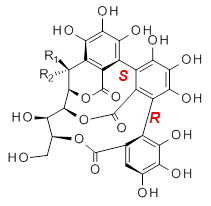
Recognizing the power of DFT computations in resolving this type of structural problem, Tanaka measured the ECD spectrum of the hydrolyzed forms of 1 and 2, namely 3 and 4. The (S,S) and (S,R) isomers of 3 and 4 were subjected to a Monte Carlo search using MM. Low-lying conformers were reoptimized at B3LYP/6-31G(d,p) including PCM, modeling methanol as the solvent. The ECD spectrum was then predicted using all conformations with a population over 1%. The computed spectrum for the (S,R) isomer reproduced the negative Cotton effect at 218 nm observed in the experiment.

3a: R1 = OH, R2 = H
4a: R1 = H, R2 = OH

3b: R1 = OH, R2 = H
3b: R1 = H, R2 = OH

The structures of 1 and 2 of both stereoisomers were next optimized at B3LYP/6-31G(d,p) including PCM. The lowest energy conformation of each is shown in Figure 1. The 1H and 13C chemical shifts were computed at this level, again using all conformations with a population greater than 1%. The correlation coefficient for the fit between the experimental values of the chemical shifts and 1a and 2a are significantly lower for both proton and carbon, while the correlation coefficients compared to 1b and 2b are larger, 0.93 or better. Therefore, the structures of vescalagin is 1b and castalagin is 2b.

1b

2b

Figure 1. B3LYP/6-31G(d,p) optimized geometries of the lowest energy conformers of 1b and 2b.

References

(1) Matsuo, Y.; Wakamatsu, H.; Omar, M.; Tanaka, T. "Reinvestigation of the Stereochemistry of the C-Glycosidic Ellagitannins, Vescalagin and Castalagin," Org. Lett. 2014, 17, 46-49, DOI: 10.1021/ol503212v.

InChIs

1: InChI=1S/C41H26O26/c42-8-1-5-12(24(48)21(8)45)13-6(2-9(43)22(46)25(13)49)39(60)65-34-11(4-63-37(5)58)64-38(59)7-3-10(44)23(47)26(50)14(7)15-18-16(28(52)32(56)27(15)51)17-19-20(30(54)33(57)29(17)53)31(55)35(66-41(19)62)36(34)67-40(18)61/h1-3,11,31,34-36,42-57H,4H2/t11-,31-,34+,35+,36-/m0/s1
InChIKey=UDYKDZHZAKSYCO-KWVBPWBCSA-N

2: InChI=1S/C41H26O26/c42-8-1-5-12(24(48)21(8)45)13-6(2-9(43)22(46)25(13)49)39(60)65-34-11(4-63-37(5)58)64-38(59)7-3-10(44)23(47)26(50)14(7)15-18-16(28(52)32(56)27(15)51)17-19-20(30(54)33(57)29(17)53)31(55)35(66-41(19)62)36(34)67-40(18)61/h1-3,11,31,34-36,42-57H,4H2/t11-,31+,34+,35+,36-/m0/s1
InChIKey=UDYKDZHZAKSYCO-GJTMBUPBSA-N

Microsolvated structure of β-propiolactone

MP &Solvation Steven Bachrach 24 Feb 2015 1 Comment

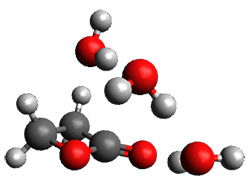
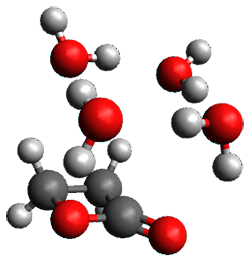
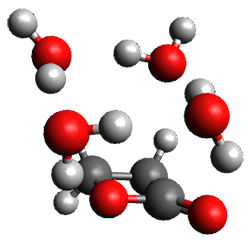
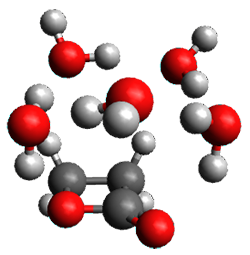
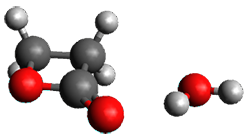
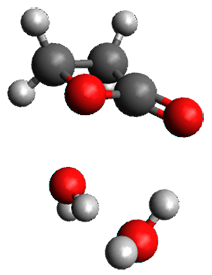
The structure of water about a solute remains of critical importance towards understanding aqueous solvation. Microwave spectroscopy and computations are the best tools we have today to gain insight on this problem. This is nicely demonstrated in the Alonso study of the microsolvated structures of β-propiolactone 1.1 They employed chirped-pulse Fourier transform microwave (CP-FTMW) spectroscopy and MP2(fc)/6-311++G(d,p) computations to examine the structure involving 1-5 water molecules.

The computed structures of these microsolvated species are shown in Figure 1. The deviation of the computed and experimental structures (RMS in the atomic positions) is small, though increasing as the size of the cluster increases. The deviation is 0.014 Å for the 1. H2O cluster and 0.244 Å for the 1.(H2O)5 cluster. They identified two clusters with four water molecules; the lower energy structure, labeled as a, is only 0.2 kJ mol-1 more stable than structure b.

1.H2O

1.(H2O)2

1.(H2O)3

1.(H2O)4 a

1.(H2O)4 b

1.(H2O)5

Figure 1. MP2(fc)/6-311++G(d,p) optimized geometries of the hydrates of 1.

Water rings are found in the clusters having four or five water molecules, while chains are identified in the smaller clusters. One might imagine water cages appearing with even more water molecules in the microsolvated structures.

References

(1) Pérez, C.; Neill, J. L.; Muckle, M. T.; Zaleski, D. P.; Peña, I.; Lopez, J. C.; Alonso, J. L.; Pate, B. H. Angew. Chem. Int. Ed. 2015, 54, 979-982, DOI: 10.1002/anie.201409057.

InChIs

1: InChI=1S/C3H4O2/c4-3-1-2-5-3/h1-2H2
InChIKey=VEZXCJBBBCKRPI-UHFFFAOYSA-N
Structures of cephalosporolide C, J, and bassianolone

NMR Steven Bachrach 16 Feb 2015 No Comments

Here is a story that must drive chemical database quality control personnel nuts. Song, et al. noticed that the reported 13C NMR of the natural products cephalosporolide C 1, cephalosporolide J 2 and bassianolone 3 are identical.1 Given that it is highly unlikely that two diastereomers would have identical NMR spectra, the likelihood that these three have identical spectra seemed remote at best.

Compounds 1 and 2 were synthesized and their structures confirmed by x-ray crystallography. Their 13C NMR spectra show clear distinctions, indicating that the isolated “2” is actually 1. Experimental support for the notion that 1 and 3 are actually the same was provided by preparing the diacetylide of 1 and comparing its NMR spectra to that of natural “3”.

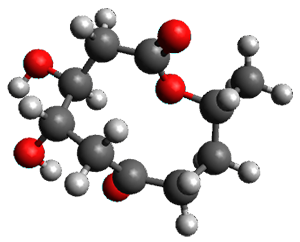
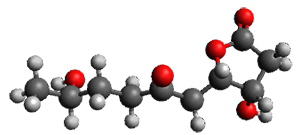
Quantum computations confirmed that in fact the natural product thought to be 3 is actually 1. The structures of 1 and 3 were optimized at B3LYP/6-311+G(2d,p) and 13C chemical shifts were computed with these geometries at mPW1PW91/6-311+G(2d,p)/CPCM(chloroform). (The computed structures are shown in Figure 1.) The mean absolute deviation (MAD) between the computed and experimental spectra for 1 is 0.97 ppm, while the MAD for the computed spectrum of 3 compared with the experimental values is 2.44 ppm, with a maximum error of 5.13ppm, more than twice the maximum error with structure 1. The authors attribute the misassignments to a faulty initial spectra of authentic cephalosporolide C 1.

1

3

Figure 1. B3LYP/6-311+G(2d,p) optimized geometries of 1 and 3.

References

(1) Song, L.; Lee, K.-H.; Lin, Z.; Tong, R. "Structural Revision of Cephalosporolide J and Bassianolone," J. Org. Chem. 2014, 79, 1493-1497, DOI: 10.1021/jo402602h.

InChIs

1: InChI=1S/C10H16O5/c1-6-2-3-7(11)4-8(12)9(13)5-10(14)15-6/h6,8-9,12-13H,2-5H2,1H3/t6-,8+,9+/m1/s1
InChIKey=JTOYXZZLKBAIEJ-YEPSODPASA-N

2: InChI=1S/C10H16O5/c1-6-2-3-7(11)4-8(12)9(13)5-10(14)15-6/h6,8-9,12-13H,2-5H2,1H3/t6-,8+,9-/m1/s1
InChIKey=JTOYXZZLKBAIEJ-BWVDBABLSA-N
3: InChI=1S/C10H16O5/c1-6(11)2-3-7(12)4-9-8(13)5-10(14)15-9/h6,8-9,11,13H,2-5H2,1H3/t6-,8+,9+/m1/s1
InChIKey=ZTRQRDNTNXPRFW-YEPSODPASA-N
« Previous PageNext Page »