Stoyanov and Reed1 have reported the IR spectrum of strong acid in water, trying to identify the true nature of the hydrated proton. In other words, what is n in the formula H(H2O)n+? The key to addressing this problem is to carefully measure the IR spectrum and then remove the signals due to (a) water associated with (or perturbed by) the anion and (b) bulk water. Simply subtracting out bulk water overcorrects because some waters are associated with the proton. By properly scaling the bulk water peak, they identify n as six. Deconvolution of the spectrum of H(H2O)6+ gives peaks at 3134 ±12, 2816 ± 40, 1746 ± 11, 1202 ± 4 and 654 ± 12 cm-1.
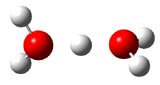
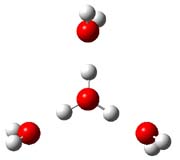
They suggest that the hydrated proton has structure 3, which is distinguished from previous proposals of H(H2O)4+ 2 and H(H2O)2+ 1.

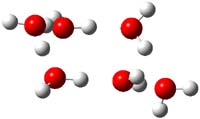
Somewhat surprising is that these authors did not compute the structures of these ions and their IR spectrum. So just to motivate further work I have computed the spectrum of the three ions at PBE1PBE/6-311++G(2df,p)//PBE1PBE/6-31+G(d,p) (Figure 1) and their uncorrected IR frequencies within the range 500-3000 cm-1 (and intensities greater than 50) are listed in Table 1.
 1 |
|
 3 |
Figure 1. PBE1PBE/6-31+G(d,p) structures of 1 and 3 and PBE1PBE/6-311++G(2df,p) of 2.
Table 1. Computed frequencies (cm-1) and intensities of 1-3.
|
1 |
2 |
3 |
|||
|
ν |
I |
ν |
I |
ν |
I |
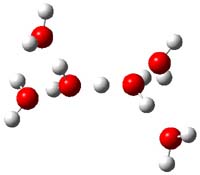
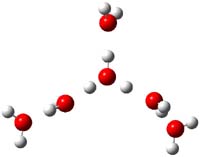
The comparison between experiment and computation leaves something to be desired and more careful computation is clearly warranted. In addition, these types of complexes are likely to be dynamic, and so multiple different configurations and conformations will need to be sampled. So, again to promote contributions to this problem, I offer three other configurations of H(H2O)6+, shown in Figure 2. Their computed IR frequencies are listed in Table 2. Any additional interested takers?
 3b |
 3c |
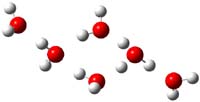 3d |
Figure 2. PBE1PBE/6-31+G(d,p) structures of 3b-3d along with their relative (to 3) electronic energy (kcal mol-1 and electronic energy with ZPE (in parenthesis).
Table 2. Computed frequencies and intensities of 3b-3d.
|
3b |
3c |
3d |
|||
|
ν |
I |
ν |
I |
ν |
I |
References
(1) Stoyanov, E. S.; Stoyanova, I. V.; Reed, C. A., "The Structure of the Hydrogen Ion (Haq+) in Water," J. Am. Chem. Soc., 2010, 132, 1484-1485, DOI: 10.1021/ja9101826

Henry Rzepa responded on 16 Feb 2010 at 3:58 pm #
I recently used the anharmonic correction to establish an effect (of putative H…H interactions). I was surprised how large the anharmonic corrections can be, even at a decent basis set level. It should be accessible for a species such as 3 (my calculation was for cyclo-octane, which is a similar size to that here), and since comparison with experiment is for the anharmonic frequencies, it might account for some of the discrepancies? Might also be worth calculating the frequencies with a continuum solvation field applied to see how that influences things?
I also cannot help but remark how protonated water has now made it into the honorary category of organic chemistry on Steve’s blog (which is otherwise restricted to the chemistry of carbon).
Steven Bachrach responded on 16 Feb 2010 at 4:04 pm #
Well, acids are important in organic chemistry too….
But yes, it’s a stretch; I thought this was an interesting paper on a very old problem – one where some computations might prove of a valuable assistance.
Henry Rzepa responded on 17 Feb 2010 at 1:39 pm #
Steve asked for takers, so here is a take. I have repeated the calculation for 3 at the level Steve quotes, namely PBE1PBE/6-31+G(d,p), with and without an applied continuum solvent field for water. The results are table-formatted below and the calculation can be viewed at DOI: 10042/to-4184. To put it in a nutshell, whilst the gas phase model for 3 is characterized by a symmetrical central O…H…O hydrogen bond minimum, in the continuum solvation field this now becomes a transition state with an imaginary frequency of -120 cm-1. Several other modes also changes substantially; others less so. I think the conclusion must be that a gas-phase model for a solvated proton is not viable, and such a model MUST be constructed by full optimization and frequency calculation in a continuum solvation field.
887
938
1091
1465
1620
1640
1643
1647
1780
907 (B)
983 (A)
1100 (B)
1478 (B)
1623 (A)
1642 (B)
1646 (B)
1654 (A)
1783 (B)
802
783?
709
1503
1602
1626
1631
1642
1751
Steven Bachrach responded on 17 Feb 2010 at 2:37 pm #
Interesting result – though not completely surprising. Compound 3 is not the lowest energy gas-phase structure of the four I located – makes one wonder what is the lowest energy H(H2O)6+ structure when a continuum field is applied. Henry’s result also goes to show that this puzzle will not be trivially solved.
Henry Rzepa responded on 17 Feb 2010 at 3:23 pm #
Regarding the search for a global minimum, perhaps the technique used to find this for the B19- cluster might also be used here (DOI: 10.1038/NCHEM.534); the Coalescence Kick procedure, or the related basin hopping search, but with the modification that the entire surface is searched within the continuum solvent model.
I might also add an addendum to the previous results. The B3LYP method is known to favour symmetrized bonding (single rather than double well potentials). It too predicts species 3 to be a transition state (-204 cm-1) for proton transfer (DOI: 10042/to-4185). It might just be possible to repeat this calculation at eg the CCSD level, and certainly at the MP2 level.
Steve writes that 3b,c or d is lower. Which? And is that in free energy or total energy?
Steven Bachrach responded on 17 Feb 2010 at 4:06 pm #
Oops – I forgot to put the energy data into the post. So both 3b and 3d are lower in electronic energy than 3, though with inclusion of ZPE, 3 is the lowest energy structure.
Henry Rzepa responded on 18 Feb 2010 at 3:19 am #
Another update. The original calculation (DOI: 10042/to-4184) for 3 in a continuum water field showed an imaginary frequency for the C2-symmetric species. Following this mode downhill results in a species with an asymmetric central hydrogen bond, and now all the vibrations are positive and the symmetry has gone (DOI: 10042/to-4186). The significance is of course that this impacts upon the thermal and entropic contributions to the free energy more than it does the enthalpy. The asymmetry is actually not that great (1.13 and 1.27Å for the two O-H distances), but is probably correlation dependent (and might of course also be solvation model dependent).
The effect upon three of the fundamental modes listed previously is as follows (original/new at the PBE1PBE/6-31+G(d,p)/SCRF level): 1751/1758, 709/1142, 802/977, which is not insignificant. It translates to a lowering of the overall free energy (including both thermal and solvation terms) by 1.4 kcal/mol, which is enough to make a discernible change to the Boltzmann population.
Because the (double well) potential is very shallow, anharmonic corrections are probably worth exploring, and I will update on that aspect shortly.
Chris Reed responded on 18 Feb 2010 at 11:51 am #
Thank you Steve and Henry for starting this debate. The liquid phase is quite different from the gas in this case. We haven’t seen any calculations that get the central O….O separation as long as we think it must be (ca. 2.55 A).
As I often tell students, “All bonds are more delocalized than we think they are”.
Steven Bachrach responded on 18 Feb 2010 at 12:11 pm #
Chris brings up the O…O distance. So as guidance here, the central O…O distance in 3 is 2.379 Å. But in 3b, the two equivalent O…O distances (involving the protonated water) are 2.486 Å, and the other one is 2.660 Å, so here’s a case where the distances are in the range Chris is expecting. The O…O distances in 3d are also long: 2.509 and 2.570 Å.
Nonetheless, I concur with Chris’ concluding statement – and I will use it in my future classes!
Henry Rzepa responded on 19 Feb 2010 at 1:41 am #
One of the key modes observed is surely the 1746 stretch, since this must correspond to a O…H…O mode. For the (somewhat) desymmetrised structure of 3 predicted using PBE1PBE/6-31+G(d,p) in a water continuum field, this stretch is predicted to be 1758, as noted above (and the perturbation introduced by the asymmetry is actually small, ie 7 cm-1). The O…O distance in this species is 2.400Å. At the B3LYP/aug-cc-pvtz level it is similarly 2.40Å. This combination of observations and calculation at least suggests that this motif, ie (slightly asymmetric) O…H…O is being modelled correctly.
My attempts to calculate the 3rd order force constants (anharmonic correction) for 3 gave silly results (see DOI: 10042/to-4226). Thus whilst normal O…H stretches are eg 3957/3720 (respectively harmonic/anharmonic), the 1758 mode noted above appears to decrease to 1390. But the sillyness, which suggests that fitting the potential to a cubic when that potential is a double-well minimum is not appropriate, is illustrated by eg the 1113 mode, which changes to -6483. Perhaps someone who has experience of this sort of thing might comment? (it may also be that attempting to calculate 3rd order force constants by finite difference whilst constraining the molecule to a solvent cavity of fixed dimension is an approximation too far?).
As for “All bonds are more delocalized than we think they are”, it also serves to remind us that bonds indeed often have (several) split personalities, and can if need be, be all things to all people. Thus bonds inferred from vibrations are probably a different beast from bonds inferred from electron distributions, etc etc. Its the usual issue that we attempt to give bonds a local meaning, but trying to coral electrons into a local environment is tough (and on which note, here is a shameless plug for my own attempts to understand what a quintuple bond actually means, and which shows how careful one must be in what one infers from the word quintuple).
Henry Rzepa responded on 19 Feb 2010 at 6:10 am #
More on structure 3d. At the PBE1PBE/6-31+G(d,p)/SCRF level, it has optimized O…O distances of 2.56 and 2.51 to the tri-coordinate oxygen. In terms of free energy (including ZPE, entropy, and all solvation free energy terms) it is 2.1 kcal/mol higher in energy than the equivalently optimized 3 (DOI: 10042/to-4227). The closest vibration to the experimental one at 1200 (which appears to be one of the crucial values) is at 1349. There is a very intense stretch at 2480 which does not appear to be matched to any experimental value and an even more intense one at 2629. On the face of it, it does not seem to match expt very well. There is a moderately intense peak at 1812.
Structure 3 had, to remind, a very intense band at 1142 and another at 1758, which do match experiment quite well (the discrepancy may well be basis set dependency).
I will try to complete the picture with 3b and 3c.
Henry Rzepa responded on 19 Feb 2010 at 12:09 pm #
Here are some results for 3b, again done at the same solvated level as the others. Its relative free energy is +0.8 kcal/mol to 3 itself (DOI: 10042/to-4259). The most intense IR vibration is 2379, with another intense vibration at 2549. Nothing of any intensity in the region 1700-1800, or indeed 1150-1250. The most intense low frequency mode is at 569.
I also include here the hydrogen/deuterated frequencies for 3, in the event that the protonated spectra reported in the original article might be repeated with D2O; 516/471, 1142/877, 1758/1286, 3117/2307, 3342/2465. The D-shifts in particular may be as informative as the absolute values.
Henry Rzepa responded on 21 Feb 2010 at 3:07 am #
Its not possible to add Jmol components to the comment field here (unless you know of a way Steve), so I have followed up some of my previous comments with animations of the normal modes calculated for species 3. Run using a aug-cc-pVTZ basis, the match of the six most intense predicted vibrations with the IR spectra reported does actually seem rather good, and my current feeling is that 3 really does represent a (predominant) structure of the hydrated proton.
Evgenii Stoyanov responded on 22 Feb 2010 at 8:43 am #
Thank all very much for interest to this short communication. However, the full paper which will be finished soon contains much more useful data for theoreticians and calculations. I hope the publication of full paper will enhance this dispute.
Steven Bachrach responded on 22 Feb 2010 at 9:33 am #
I look forward to the full paper. I would like to add that I don’t think there is any “dispute” here – just a lot of interest in understanding the structure of the H(H6O)6+ species! I have always been skeptical of the idea of the hydronium ion H3O+ so I was very excited about your communication!
The structure of the hydrogen ion in water. « Henry Rzepa responded on 24 Feb 2010 at 4:11 am #
[…] where n=6 (DOI: 10.1021/ja9101826). This suggestion was picked up by Steve Bachrach on his blog, where he added a further three structures to the proposed list, and noted of course that with this […]
Chris Reed responded on 27 Feb 2010 at 9:27 am #
Other than the O….O distance, two other issues interest me.
1. The H/D ratios for Henry’s calculated band frequencies are all in the range 1.32-1.38 except for the 476/438 cm-1 band where it is 1.09. Does this mean all bands are calculated to be harmonic except the low frequency one? Would the comparison of calculated and experimental H/D ratios be better criteria for fit than simply comparing frequencies?
2. What about the continuous broad absorption (cba) which is such a characteristic feature of the Haq+ IR spectrum? It seems to be ignored by theory.
Ken Jordan responded on 27 Feb 2010 at 8:45 pm #
Chris, Steve, and Henry –
I will try to send along some detailed comments in a few days. I need to take care of a couple of things with hard deadlines first.
A couple of quick comments – the calculated and measured vibrational spectra of several of these clusters (in the gas phase) have been reported in the literature. Actually, Mike Duncan and I just had a paper on H+(H2O)n, n </=5, and we are working on a manuscript on the larger clusters.
Yes, vibrational anharmonicity is very large for some of the clusters. This is noted in the Science paper with Mark, Mike, and myself. Note it is so large, that vibrational perturbation theory fails in some cases.
Concerning the proton in bulk water, there are several “ab initio” MD simulations, some with quantum corrections. These have been interpreted as providing evidence for both eigen and zundel-type structures.
Ken
Greg Voth responded on 27 Feb 2010 at 9:34 pm #
Please read the two papers below and they will better explain to you the structure of the hydrated proton in liquid water. The hydrated proton is actually an electron “defect” or “hole” in the liquid. It is best described as a “distorted Eigen” cation that is dynamic. There is a special pair strong O-O “h-bond” that oscillates between three equivalent O-O strong h-bonds for about 1 ps (but with a single common central O atom for all three specal O-O h-bonds), before the whole structure undergoes a Grotthuss hop to a nearby distorted Eigen structure of the same symmetry, but involving one or more different water molecules. On average the number of waters associated with this dynamic structure is about six like in panel #3 above, but it is not the extended Zundel structure shown in panel #3 above. The O-O special pair bond length is about 2.5 angstroms, but again this is a dynamic structure involving three such O-O h-bonds. These special dynamic O-O h-bonds involve significant charge transfer and so are transiently semi-covalent before switching to another such equivalent O-O special O-O h-bond in the dynamic distorted Eigen structure. I believe the structure advocated by panel #3 above is a misinterpretation or overinterpretation of the experimental liquid state IR results. Gas phase concepts from both IR spectroscopy and quantum chemistry are not especially useful for this liquid state problem (in fact, they seem to add confusion).
Markovitch et al, J. Phys. Chem. B 2008, 112, 9456–9466
Swanson and Simons, J. Phys. Chem. B, 2009, 113 (15), 5149-5161
An earlier paper that is also informative on the IR spectrum of the hydrated proton is
Kim, et al, “The Vibrational Spectrum of the Hydrated Proton: Comparison of Experiment, Simulation, and Normal Mode Analysis,” J. Chem. Phys. 116, 737-746 (2002).
We will submit a paper soon better clarifying these points.
Greg Voth
Henry Rzepa responded on 03 Mar 2010 at 1:42 pm #
Chris Reed asks The H/D ratios for Henry’s calculated band frequencies are all in the range 1.32-1.38 except for the 476/438 cm-1 band where it is 1.09. Does this mean all bands are calculated to be harmonic except the low frequency one?
All the bands were calculated as harmonic (an anharmonic 3rd derivative calculation gave odd results which I don’t understand and which may be a failure of the type Ken notes). As for the 476 mode, the vectors show it to be an oscillation of the central hydrogen between the two oxygens, but with much other motion (see here for an animation) Curiously, for this mode the 18O/16O shift is as high as 23 cm-1 (the other shifts range from 7-15) or 1.05, which is relatively high for oxygen.
Greg Voth implies that gas phase concepts from IR spectroscopy re not especially useful, but an empirical test would be whether such a model fits most of the significant aspects, including isotope shifts and other variations. The cba feature I do not wish to comment on, since I have not yet assimilated its origins.
The structure of the hydrogen ion in water. « ArchivePress + APrints responded on 16 Mar 2010 at 5:18 pm #
[…] where n=6 (DOI: 10.1021/ja9101826). This suggestion was picked up by Steve Bachrach on his blog, where he added a further three structures to the proposed list, and noted of course that with this […]