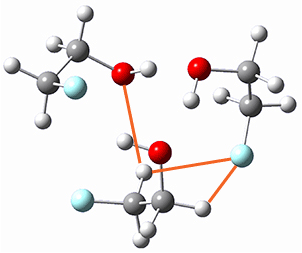
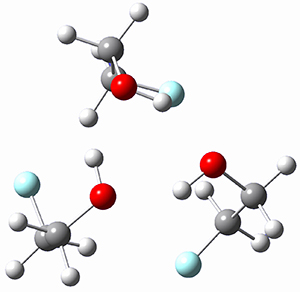
Here is another fine example of the power of combining experiment and computation. Xu and co-worker has applied the FT microwave technique, which has been used in conjunction with computation by the Alonso group (especially) as described in these posts, to the trimer of 2-fluoroethanol.1 They computed a number of trimer structures at MP2/6-311++G(2d,p) in an attempt to match up the computed spectroscopic constants with the experimental constants. The two lowest energy structures are shown in Figure 1. The second lowest energy structure has nice symmetry, but it does not match up well with the experimental spectra. However, the lowest energy structure is in very good agreement with the experiments.
|
(0.0) |
(4.15) |
Table 1. MP2/6-311++G(2d,p) optimized structures and relative energies (kJ mol-1) of the two lowest energy structures of the trimer of 2-fluoroethanol. The added orange lines in the lowest energy structure denote the bifurcated hydrogen bonds identified by QTAIM.
Of particular note is that topological electron density analysis (also known as quantum theoretical atoms in a molecule, QTAIM) of the wavefunction of the lowest energy structure of the trimer identifies two hydrogen bond bifurcations. The authors suggest that these additional interactions are responsible, in part, for the stability of this lowest energy structure.
References
(1) Thomas, J.; Liu, X.; Jäger, W.; Xu, Y. "Unusual H-Bond Topology and Bifurcated H-bonds in the 2-Fluoroethanol Trimer," Angew. Chem. Int. Ed. 2015, 54, 11711-11715, DOI: 10.1002/anie.201505934.
InChIs
2-fluoroethanol: InChI=1S/C2H5FO/c3-1-2-4/h4H,1-2H2, InChIKey=GGDYAKVUZMZKRV-UHFFFAOYSA-N


Henry Rzepa responded on 23 Oct 2015 at 6:37 am #
QTAIM can be criticised that Bond critical points (in many people’s minds, these should really be termed line critical points, since they are not necessarily in correspondence with what many think of as a chemical bond) direct attention to just a single point in space and the topology of the density there.
Another approach gaining favour is the NCI (non covalent interaction) method, which looks at the properties of regions of space and not just a single point. An analogy might be the comparison between the single point NICS metric and the current and magnetic densities of regions of space.
I have obtained the NCI surface for the lowest energy form shown above and this is shown below (as a static surface; a fully 3D-explorable surface will go up on my blog shortly).
What is shown above as orange lines (or bond critical paths) in the schematic above is represented by isosurfaces of reduced density gradients below (orange arrows). One gains information from the colour coding derived from the value of λ2, the second eigenvalue of the density laplacian, which indicates whether the region is stabilising or destabilising (attractive or repulsive if you will). Green is typically weakly attractive and associated mainly with dispersion effects. Blue is strongly attractive and corresponds to the classical hydrogen bonds.
The point I make here is that apart from the two regions which have been picked out in the article as responsible for stabilisation of the low energy structure, there are are around 4-5 OTHER regions that also may be stabilising but for which there is no corresponding critical point in the density. So whilst the above origins are not incorrect, they may well be very incomplete!