The structure of organic molecules of biochemical significance remains an important pursuit, one that I have discussed in a number of blog posts. Highlighted particularly in this blog (and in my book) has been the interplay of experiment and computation in structure determination. Dopfer and co-workers combine IR multiple photon dissociation (IRMPD) with DFT and MP2 computations to determine the structure of protonated serotonin 1H+.1
|
|

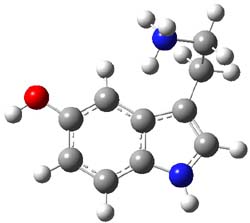
B3LYP/cc-pVDZ and MP2/cc-pVDZ computations of the conformations of 1H+ give nearly identical results. The lowest energy conformer (see Figure 1) has the ethylamine group in a gauche arrangement so that the protonated amine can interact with the π-system of the ring. The hydroxyl group is orientated trans relative to the ethylamine group. Conformer generated by rotation about the C-O bond or the C-C and C-N bond of the ethylamine group are higher in energy, anywhere from 0.5 to about 5 kcal mol-1 above the lowest conformer. Protonation at the ring nitrogen or the oxygen are more than 20 kcal mol-1 higher in energy than the lowest conformer.
 1H+ |
Figure 1. B3LYP/6-31G(d) optimized geometry of 1H+. Note that the authors did not supply sufficient information in their supporting materials to generate the full 3-D coordinates of the molecule, and I did not want to reoptimize at cc-pVDZ. Referees – please insist on complete supporting information!
Comparison of the experimental IR spectrum of 1H+ with the computed IR frequencies (either B3LYP or MP2 – they are very similar) reveals a remarkable agreement with the computed spectra of just the lowest energy conformer. While the lowest energy conformer is predicted to be nearly 70% of the population, there is little spectroscopic evidence of the participation of any other conformer. In fact, the next three lowest energy conformers have a distinctive peak (in their computed IR spectrum) at about 1400 cm-1, a region that has virtually no absorption in the experimental IR.
References
(1) Lagutschenkov, A.; Langer, J.; Berden, G.; Oomens, J.; Dopfer, O., "Infrared Spectra of Protonated Neurotransmitters: Serotonin," J. Phys. Chem. A, 2010, 114, 13268-13276, DOI: 10.1021/jp109337a
InChIs
serotonin: InChI=1/C10H12N2O/c11-4-3-7-6-12-10-2-1-8(13)5-9(7)10/h1-2,5-6,12-13H,3-4,11H2
InChIKey=QZAYGJVTTNCVMB-UHFFFAOYAX
1H+: InChI=1/C10H12N2O/c11-4-3-7-6-12-10-2-1-8(13)5-9(7)10/h1-2,5-6,12-13H,3-4,11H2/p+1/fC10H13N2O/h11H/q+1
InChIKey=QZAYGJVTTNCVMB-HISXSYJOCA

Henry Rzepa responded on 09 Mar 2011 at 2:30 am #
I am not convinced by the π-interaction of N-H…ring. The angle is all wrong. A QTAIM would be particularly worthwhile here.