Archive for the 'QM Method' Category

Keto-enol Benchmark Study

The keto-enol tautomerization is a fundamental concept in organic chemistry, taught in the introductory college course. As such, it provides an excellent test reaction to benchmark the performance computational methods. Acevedo and colleagues have reported just such a benchmark study.1

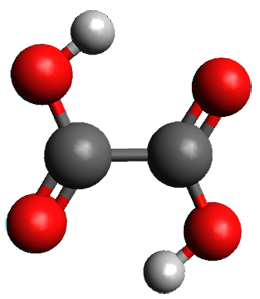
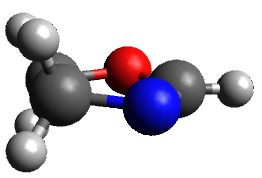
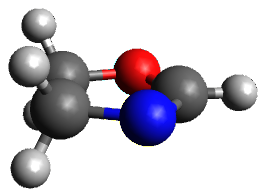
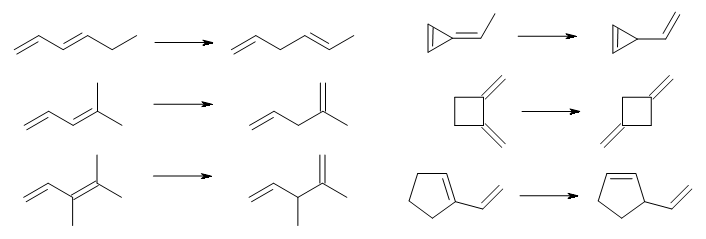
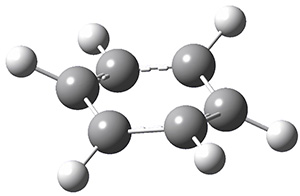
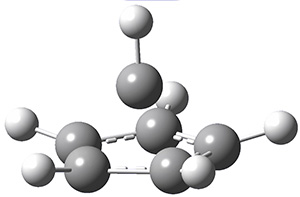
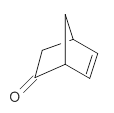
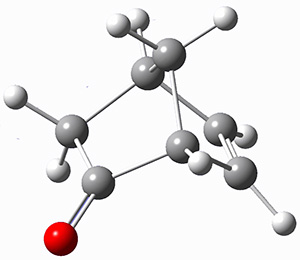
First, the compare a wide variety of methods, ranging from semi-empirical, to DFT, and to composite procedures, with experimental gas-phase free energy of tautomerization. They use seven such examples, two of which are shown in Scheme 1. The best results from each computation category are AM1, with a mean absolute error (MAE) of 1.73 kcal mol-1, M06/6-31+G(d,p), with a MAE of 0.71 kcal mol-1, and G4, with a MAE of 0.95 kcal mol-1. All of the modern functionals do a fairly good job, with MAEs less than 1.3 kcal mol-1.
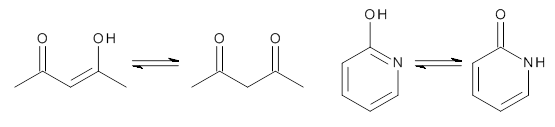
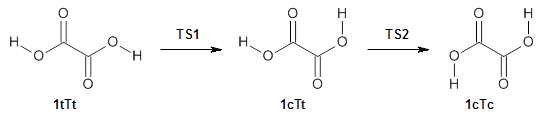
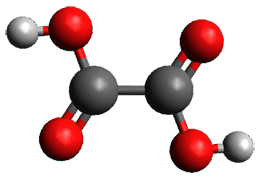
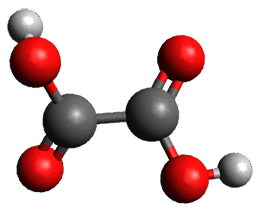
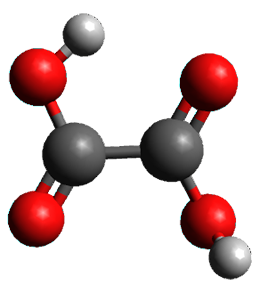

Scheme 1

As might be expected, the errors were appreciably larger for predicting the free energy of tautomerization, with a good spread of errors depending on the method for handling solvent (PCM, CPCM, SMD) and the choice of cavity radius. The best results were with the G4/PCM/UA0 procedure, though M06/6-31+G(d,p)/PCM and either UA0 or UFF performed quite well, at considerably less computational expense.

References

(1) McCann, B. W.; McFarland, S.; Acevedo, O. "Benchmarking Continuum Solvent Models for Keto–Enol Tautomerizations," J. Phys. Chem. A 2015, 119, 8724-8733, DOI: 10.1021/acs.jpca.5b04116.

Keto-enol tautomerization &QM Method Steven Bachrach 12 Oct 2015 No Comments

Domino Tunneling

A 2013 study of oxalic acid 1 failed to uncover any tunneling between its conformations,1 despite observation of tunneling in other carboxylic acids (see this post). This was rationalized by computations which suggested rather high rearrangement barriers. Schreiner, Csaszar, and Allen have now re-examined oxalic acid using both experiments and computations and find what they call domino tunneling.2

First, they determined the structures of the three conformations of 1 along with the two transition states interconnecting them using the focal point method. These geometries and relative energies are shown in Figure 1. The barrier for the two rearrangement steps are smaller than previous computations suggest, which suggests that tunneling may be possible.

1tTt
(0.0)

TS1
(9.7)

1cTt
(-1.4)

TS2
(9.0)

1cTc
(-4.0)

Figure 1. Geometries of the conformers of 1 and the TS for rearrangement and relative energies (kcal mol-1)

Placing oxalic acid in a neon matrix at 3 K and then exposing it to IR radiation populates the excited 1tTt conformation. This state then decays to both 1cTt and 1cTc, which can only happen through a tunneling process at this very cold temperature. Kinetic analysis indicates that there are two different rates for decay from both 1tTt and 1cTc, with the two rates associated with different types of sites within the matrix.

The intrinsic reaction paths for the two rearrangements: 1tTt1cTt and → 1cTc were obtained at MP2/aug-cc-pVTZ. Numerical integration and the WKB method yield similar half-lives: about 42 h for the first reaction and 23 h for the second reaction. These match up very well with the experimental half-lives from the fast matrix sites of 43 ± 4 h and 30 ± 20 h, respectively. Thus, the two steps take place sequentially via tunneling, like dominos falling over.

References

(1) Olbert-Majkut, A.; Ahokas, J.; Pettersson, M.; Lundell, J. "Visible Light-Driven Chemistry of Oxalic Acid in Solid Argon, Probed by Raman Spectroscopy," J. Phys. Chem. A 2013, 117, 1492-1502, DOI: 10.1021/jp311749z.

(2) Schreiner, P. R.; Wagner, J. P.; Reisenauer, H. P.; Gerbig, D.; Ley, D.; Sarka, J.; Császár, A. G.; Vaughn, A.; Allen, W. D. "Domino Tunneling," J. Am. Chem. Soc. 2015, 137, 7828-7834, DOI: 10.1021/jacs.5b03322.

InChIs

1: InChI=1S/C2H2O4/c3-1(4)2(5)6/h(H,3,4)(H,5,6)
InChIKey=MUBZPKHOEPUJKR-UHFFFAOYSA-N

focal point &Schreiner &Tunneling Steven Bachrach 11 Aug 2015 1 Comment

Structure of 2-oxazoline

A recent reinvestigation of the structure of 2-oxazoline demonstrates the difficulties that many computational methods can still have in predicting structure.

Samdal, et al. report the careful examination of the microwave spectrum of 2-oxzoline and find that the molecule is puckered in the ground state.1 It’s not puckered by much, and the barrier for inversion of the pucker, through a planar transition state is only 49 ± 8 J mol-1. The lowest vibrational frequency in the non-planar ground state, which corresponds to the puckering vibration, has a frequency of 92 ± 15 cm-1. This low barrier is a great test case for quantum mechanical methodologies.

And the outcome here is not particularly good. HF/cc-pVQZ, M06-2X/cc-pVQZ, and B3LYP/cc-pVQZ all predict that 2-oxazoline is planar. More concerning is that CCSD and CCSD(T) with either the cc-pVTZ or cc-pVQZ basis sets also predict a planar structure. CCSD(T)-F12 with the cc-pVDZ predicts a non-planar ground state with a barrier of only 8.5 J mol-1, but this barrier shrinks to 5.5 J mol-1 with the larger cc-pVTZ basis set.

The only method that has good agreement with experiment is MP2. This method predicts a non-planar ground state with a pucker barrier of 11 J mol-1 with cc-pVTZ, 39.6 J mol-1 with cc-pVQZ, and 61 J mol-1 with the cc-pV5Z basis set. The non-planar ground state and the planar transition state of 2-oxazoline are shown in Figure 1. The computed puckering vibrational frequency does not reproduce the experiment as well; at MP2/cc-pV5Z the predicted frequency is 61 cm-1 which lies outside of the error range of the experimental value.

Non-planar

Planar TS

Figure 1. MP2/cc-pV5Z optimized geometry of the non-planar ground state and the planar transition
state of 2-oxazoline.

References

(1) Samdal, S.; Møllendal, H.; Reine, S.; Guillemin, J.-C. "Ring Planarity Problem of 2-Oxazoline Revisited Using Microwave Spectroscopy and Quantum Chemical Calculations," J. Phys. Chem. A 2015, 119, 4875–4884, DOI: 10.1021/acs.jpca.5b02528.

InChIs

2-oxazoline: InChI=1S/C3H5NO/c1-2-5-3-4-1/h3H,1-2H2
InChIKey=IMSODMZESSGVBE-UHFFFAOYSA-N

MP &vibrational frequencies Steven Bachrach 15 Jun 2015 1 Comment

Gas phase structure of uridine

To advance our understanding of why ribose takes on the furanose form, rather than the pyranose form, in RNA, Alonso and co-workers have examined the structure of uridine 1 in the gas phase.1


1

Uridine is sensitive to temperature, and so the laser-ablation method long used by the Alonso group is ideal for examining uridine. The microwave spectrum is quite complicated due to the presence of many photofragments. Careful analysis lead to the identification of a number of lines and hyperfine structure that could be definitively assigned to uridine, leading to experimental values of the rotational constants and the diagonal elements of the 14N nuclear quadrupole coupling tensor for each nitrogen. These values are listed in Table 1.

Table 1. Experimental and calculated rotational constants (MHz), quadrupole coupling constants (MHz) and relative energy (kcal mol-1).


calculated


Expt.

anti/C2’-endo-g+

syn/C2’-endo-g+

anti/C3’-endo-g+

anti/C2’-endo-t

syn/C3’-endo-g+

A

885.98961

901.2

935.8

790.0

799.7

925.5

B

335.59622

340.6

308.4

352.6

330.6

300.4

C

270.11210

276.6

266.6

261.4

262.9

264.0

14N1 χxx

1.540

1.50

1.82

1.48

1.46

1.82

14N1 χyy

1.456

1.43

0.73

1.71

1.81

-0.72

14N1 χzz

-2.996

-2.93

-2.56

-3.19

-3.27

-1.11

14N3 χxx

1.719

1.74

2.03

1.78

1.62

1.98

14N3 χyy

1.261

1.11

0.47

1.34

1.51

-0.75

14N3 χzz

-2.979

-2.85

-2.50

-3.12

-3.13

-1.23

Rel E


0.0

1.10

1.90

2.00

2.15

In order to assign a 3-D structure to these experimental values, they examined the PES of uridine with molecular mechanics and semi-empirical methods, before reoptimizing the structure of the lowest 5 energy structures at MP2/6-311++G(d,p). Then, comparison of the resulting rotational constants and 14N nuclear quadrupole coupling constants of these computed structures (see Table 1) led to identification of the lowest energy structure (anti/C2’-endo-g+, see Figure 1) in best agreement with the experiment. Once again, the Alonso group has demonstrated the value of the synergy between experiment and computation in structure identification.

Figure 1. MP2/6-311++G(d,p) optimized structure of 1 (anti/C2’-endo-g+).

References

(1) Peña, I.; Cabezas, C.; Alonso, J. L. "The Nucleoside Uridine Isolated in the Gas Phase," Angew. Chem. Int. Ed. 2015, 54, 2991-2994, DOI: 10.1002/anie.201412460.

Inchis:

1: Inchi=1S/C9H12N2O6/c12-3-4-6(14)7(15)8(17-4)11-2-1-5(13)10-9(11)16/h1-2,4,6-8,12,14-15H,3H2,(H,10,13,16)/t4-,6-,7-,8-/m1/s1
InChiKey=DRTQHJPVMGBUCF-XVFCMESISA-N

MP &nucleic acids Steven Bachrach 06 Apr 2015 No Comments

Microsolvated structure of β-propiolactone

The structure of water about a solute remains of critical importance towards understanding aqueous solvation. Microwave spectroscopy and computations are the best tools we have today to gain insight on this problem. This is nicely demonstrated in the Alonso study of the microsolvated structures of β-propiolactone 1.1 They employed chirped-pulse Fourier transform microwave (CP-FTMW) spectroscopy and MP2(fc)/6-311++G(d,p) computations to examine the structure involving 1-5 water molecules.

The computed structures of these microsolvated species are shown in Figure 1. The deviation of the computed and experimental structures (RMS in the atomic positions) is small, though increasing as the size of the cluster increases. The deviation is 0.014 Å for the 1. H2O cluster and 0.244 Å for the 1.(H2O)5 cluster. They identified two clusters with four water molecules; the lower energy structure, labeled as a, is only 0.2 kJ mol-1 more stable than structure b.

1.H2O

1.(H2O)2

1.(H2O)3

1.(H2O)4 a

1.(H2O)4 b

1.(H2O)5

Figure 1. MP2(fc)/6-311++G(d,p) optimized geometries of the hydrates of 1.

Water rings are found in the clusters having four or five water molecules, while chains are identified in the smaller clusters. One might imagine water cages appearing with even more water molecules in the microsolvated structures.

References

(1) Pérez, C.; Neill, J. L.; Muckle, M. T.; Zaleski, D. P.; Peña, I.; Lopez, J. C.; Alonso, J. L.; Pate, B. H. Angew. Chem. Int. Ed. 2015, 54, 979-982, DOI: 10.1002/anie.201409057.

InChIs

1: InChI=1S/C3H4O2/c4-3-1-2-5-3/h1-2H2
InChIKey=VEZXCJBBBCKRPI-UHFFFAOYSA-N

MP &Solvation Steven Bachrach 24 Feb 2015 1 Comment

Benchmarking π-conjugation

With the proliferation of density functionals, selecting the functional to use in your particular application requires some care. That is why there have been quite a number of benchmark studies (see these posts for some examples). Yu and Karton have now added to our benchmark catalog with a study of π-conjugation.1

They looked at a set of 60 reactions which involve a reactant with π-conjugation and a product which lacks conjugation. A few examples, showing examples involving linear and cyclic systems, are shown in Scheme 1.

Scheme 1.

The reaction energies were evaluated at W2-F12, which should have an error of a fraction of a kcal mol-1. Three of the reactions can be compared with experimental values, and difference in the experimental and computed values are well within the error bars of the experiment. It is too bad that the authors did not also examine 1,3-cyclohexadiene → 1,4-cyclohexadiene, a reaction that is both of broader interest than many of the ones included in the test set and can also be compared with experiment.

These 60 reactions were then evaluated with a slew of functionals from every rung of Jacob’s ladder. The highlights of this benchmark study are that most GGA and meta-GGA and hybrid functionals (like B3LYP) have errors that exceed chemical accuracy (about 1 kcal mol-1). However, the range-separated functionals give very good energies, including ωB97X-D. The best results are provided with double hybrid functionals. Lastly, the D3 dispersion correction does generally improve energies by 10-20%. On the wavefunction side, SCS-MPs gives excellent results, and may be one of the best choices when considering computational resources.

References

(1) Yu, L.-J.; Karton, A. "Assessment of theoretical procedures for a diverse set of isomerization reactions involving double-bond migration in conjugated dienes," Chem. Phys. 2014, 441, 166-177, DOI: 10.1016/j.chemphys.2014.07.015.

DFT Steven Bachrach 14 Jan 2015 2 Comments

Becke’s Perspective on DFT

The Journal of Chemical Physics has produced a Special Topics issue on Advances in Density Functional Theory. I want to call to your attention the Perspective article by Becke titled “Perspective: Fifty years of density-functional theory in chemical physics”.1 Becke writes a personal account of the history of DFT and makes a number of interesting points and observations. He rightly notes that DFT is exact and we should more properly refer to our actual implementations as Density Functional Approximations (DFA). He also notes that use of the term ab initio as a synonym for wavefunction theory is inappropriate as DFT is just as ab initio as HF and post-HF theories.

A common perception about DFT (well, DFA) is that there is no way to systematically improve functionals. Becke exposes a true underlying logic that has driven much of DFA development.

Lastly, Becke is discouraged by the more recent developments that have included virtual orbitals, such as double hybrid methods. His approach is that true DFT is occupied orbitals only (for which he pointedly does not want to adopt the acronym OOO), and that developments that include the virtual orbitals might toll the “death knell” for DFT.

For those interested in a pretty accessible account of the history of DFT, Becke’s Perspective is an excellent place to get started.

References

(1) Becke, A. D. "Perspective: Fifty years of density-functional theory in chemical physics," J. Chem. Phys. 2014, 140, 18A301 DOI: 10.1063/1.4869598.

DFT Steven Bachrach 24 Sep 2014 No Comments

Structure of benzene dication

Benzene is certainly one of the most iconic chemical compounds – its planar hexagonal structure is represented often in popular images involving chemists, and its alternating single and double bonds the source of one of chemistry’s most mythic stories: Kekule’s dream of a snake biting its own tail. So while the structure of benzene is well-worn territory, what of the structure of the benzene dication? Jasik, Gerlich and Rithova probe that question using a combined experimental and computational approach.1

The experiment involves generation of the benzene dication at low temperature and complexed
to helium. Then, using infrared predissociation spectroscopy (IRPD), they obtained a spectrum that suggested two different structures.

Next, employing MP2/aug-cc-pVTZ computations, they identified a number of possible geometries, and the two lowest energy singlet dications have the geometries shown in Figure 1. The first structure (1) has a six member ring, but the molecule is no longer planar. Lying a bit lower in energy is 2, having a pentagonal pyramid form. The combination of the computed IR spectra of each of these two structures matches up extremely well with the experimental spectrum.

1

2

Figure 1. MP2/aug-cc-pVTZ geometries of benzene dication 1 and 2.

References

(1) Jašík, J.; Gerlich, D.; Roithová, J. "Probing Isomers of the Benzene Dication in a Low-Temperature Trap," J. Am. Chem. Soc. 2014, 136, 2960-2962, DOI: 10.1021/ja412109h.

Aromaticity &MP Steven Bachrach 08 Apr 2014 3 Comments

Computing OR: norbornenone

Optical activity is a major tool for identifying enantiomers. With recent developments in computational techniques, it is hoped that experiments combined with computations will be a powerful tool for determining absolute configuration. The recent work of Lahiri, et al. demonstrates the scope of theoretical work that is still needed to really make this approach broadly applicable.1

They prepared (1R,4R)-norbornenone 1 and measured its optical rotation in the gas phase and in dilute solutions of acetonitrile and cyclohexane. The specific rotations at three different wavelengths are listed in Table 1. Of first note is that though there is some small differences in solution, as expected, there really is substantial differences between the gas- and solution phases. Thus cautionary point 1: be very careful of comparing solution phase experimental optical activity with computed gas phase predictions.


1

Table 1. Experimental and computed specific rotation of 1.


355.0 nm

589.3 nm

633.0 nm

Gas phase

Expt

6310

755

617

B3LYP

10887

1159

944

CCSD

3716

550

453

Acetonitrile solution

Expt

8607

950

776

PCM/B3LYP

11742

1277

1040

Cyclohexane solution

Expt

9159

981

799

PCM/B3LYP

11953

1311

1069

For the computations, the geometry of 1 was optimized at B3LYP/aug-cc-pVTZ (see Figure 1. The OR was computed at B3LYP with different basis sets, finding that the difference in the predicted specific rotation at 598.3nm differs only quite little (90.6 deg dm-1 (g/mL)-1) between the computations using aug-cc-pVTZ and aug-cc-pVQZ) suggesting that the basis set limit has been reached. The gas –phase computed values at B3LYP and CCSD are also shown in Table 1. Though these computations do get the correct sign of the rotation, they are appreciably off of the experimental values, and the percent error varies with wavelength. Cautionary point 2: it is not obvious what is the appropriate computational method to compute OR, and beware of values that seem reasonable at one wavelength – this does not predict a good agreement at a different wavelength.

Figure 1. Optimized geometry of 1 at B3LYP/aug-cc-pVTZ.

Lastly, computed solution values of the OR were performed with PCM and B3LYP. These values are given in Table 1. Again the agreement is poor. So cautionary point 3: computed (PCM) solution OR
may be in quite poor agreement with experiment.

Often the culprit to poor agreement between computed and experimental OR is attributed to omitted vibrational effects, but in this case, because 1 is so rigid, one might not expect too much error to be caused by the effects of vibrations. So the overall result – we need considerable work towards addressing how to accurately compute optical activity!

References

(1) Lahiri, P.; Wiberg, K. B.; Vaccaro, P. H.; Caricato, M.; Crawford, T. D. "Large Solvation Effect in the Optical Rotatory Dispersion of Norbornenone," Angew. Chem. Int. Ed. 2014, 53, 1386-1389, DOI: 10.1002/anie.201306339.

InChIs

1: InChI=1S/C7H8O/c8-7-4-5-1-2-6(7)3-5/h1-2,5-6H,3-4H2/t5-,6+/m1/s1
InChIKey=HUQXEIFQYCVOPD-RITPCOANSA-N

DFT &Optical Rotation Steven Bachrach 25 Feb 2014 2 Comments

Gas phase structure of 2-deoxyribose

2-deoxyribose 1 is undoubtedly one of the most important sugars as it is incorporated into the backbone of DNA. The conformational landscape of 1 is complicated: it can exist as an open chain, as a five-member ring (furanose), or a six-member ring (pyranose), and intramolecular hydrogen bonding can occur. This internal hydrogen bonding is in competition with hydrogen bonding to water in aqueous solution. Unraveling all this is of great interest in predicting structures of this and a whole host of sugar and sugar containing-molecules.


1

In order to get a firm starting point, the gas phase structures of the low energy conformers of 1 would constitute a great set of structures to use as a benchmark for gauging force fields and computational methods. Cocinero and Alonso1 have performed a laser ablation molecular beam Fourier transform microwave (LA-MB-FTMW) experiment (see these posts for other studies using this technique) on 1 and identified the experimental conformations by comparison to structures obtained at MP2/6-311++G(d,p). Unfortunately the authors do not include these structures in their supporting materials, so I have optimized the low energy conformers of 1 at ωB97X-D/6-31G(d) and they are shown in Figure 1.

1a (0.0)

1b (4.7)

1c (3.3)

1d (5.6)

1e (8.9)

1f (9.4)

Figure 1. ωB97X-D/6-31G(d) optimized structures of the six lowest energy conformers of 1. Relative free energy in kJ mol-1.

The computed spectroscopic parameters were used to identify the structures responsible for the six different ribose conformers observed in the microwave experiment. To give a sense of the agreement between the computed and experimental parameters, I show these values for the two lowest energy conformers in Table 1.

Table 1. MP2/6-311++G(d,p) computed and observed spectroscopic parameters for the two lowest energy conformers of 1.


1a

1c


Expt

Calc

Expt

Calc

A(MHz)

2484.4138

2492

2437.8239

2447

B (MHz)

1517.7653

1533

1510.7283

1527

C (MHz)

1238.9958

1250

1144.9804

1158

ΔG (kJ mol-1)


0.0


3.3

This is yet another excellent example of the symbiotic relationship between experiment and computation in structure identification.

References

(1) Peña, I.; Cocinero, E. J.; Cabezas, C.; Lesarri, A.; Mata, S.; Écija, P.; Daly, A. M.; Cimas, Á.; Bermúdez, C.; Basterretxea, F. J.; Blanco, S.; Fernández, J. A.; López, J. C.; Castaño, F.; Alonso, J. L. "Six Pyranoside Forms of Free 2-Deoxy-D-ribose," Angew. Chem. Int. Ed. 2013, 52, 11840-11845, DOI: 10.1002/anie.201305589.

InChIs

1a: InChI=1S/C5H10O4/c6-3-1-5(8)9-2-4(3)7/h3-8H,1-2H2/t3-,4+,5-/m0/s1
InChIKey=ZVQAVWAHRUNNPG-LMVFSUKVSA-N

MP &sugars Steven Bachrach 16 Dec 2013 No Comments

« Previous PageNext Page »