Demonstrating the occurrence of non-statistical dynamics generally has been accomplished through trajectory studies. These trajectory studies are often quite computationally demanding, requiring many trajectories, often of long duration, with molecules that are typically not small! Schmittel and co-workers present a case where their evidence for non-statistical dynamics rests not on trajectory studies but a combination of experimental product distributions and free energy of activation computations.1
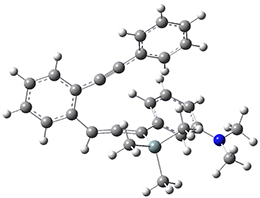
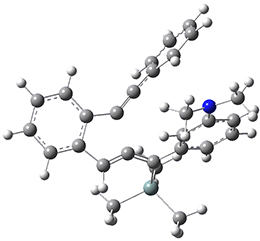
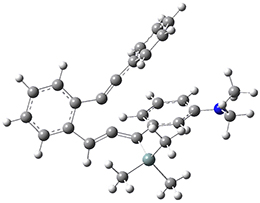
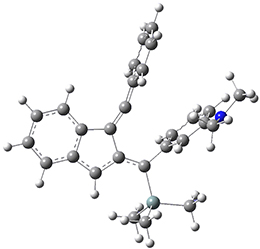
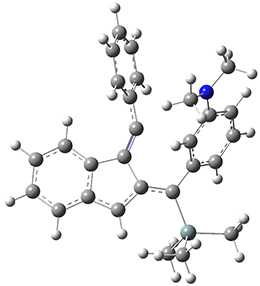
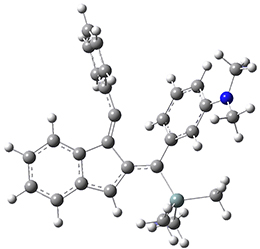
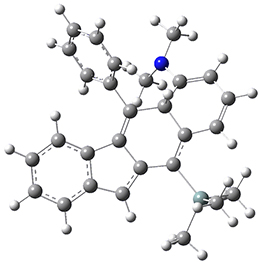
For the Schmittel C2-C6 cyclization taking 1 into 5¸Schmittel has located no concerted transition state, but rather two different transition states 2 and 2’, leading to a common intermediate diradical 3. Then there are two different transition states 4 and 4’ leading to the two regioisomeric products 5 and 5’. The BLYP/6-31G* structures and relative free energies are shown in Figure 1.
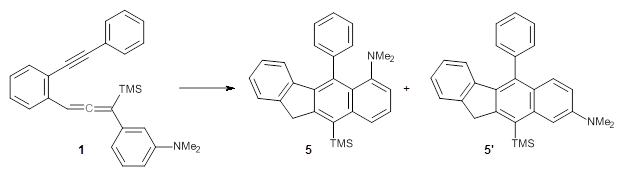
1 |
|
2 |
2’ |
3 |
|
4 |
4’ |
5 |
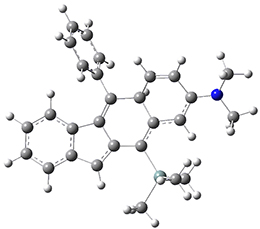
5’ |
Figure 1. BLYP/6-31G*geometries and relative free energies (kcal mol-1) of the critical points along the reaction 1 → 5.
If transition state theory (TST) holds here, the rate limiting step is the first set of transition states, and the product distribution should be dictated by the second set of transition states. Since 4’ is lower in energy than 4, TST predicts that 5’ should be the major product. However, the experiments show that the ratio 5:5’ ranges from 1.48 at 30 °C to 1.65 at 60 °C, with the ratio decreasing a bit at higher temperatures still.
Examination of the potential energy surfaces in the neighborhoods of the transition states and the intermediate show a couple of interesting features. First, there is a large barrier separating 2 and 2’ and this precludes the concerted pathway. Second, the minimum energy path forward from 2 requires a sharp turn to proceed to the intermediate 3. Schmittel suggests that this surface supports the notion of some direct reaction paths from 2 avoiding the intermediate 3 and directly over transition state 4’. Schmittel offers a simple formula for predicting the percentage of the products formed from a non-statistical pathway:
XNSQ1 + XSQ2 = Qexp
where XNS is the mole fraction following non-statistical pathways and XS is the fraction following a statistical pathway and Qexp is the experimental mole ratio and Q1 is the partitioning at the first set of TSs and Q2 is the partitioning at the second set of TSs. While this approach is certainly much simpler than performing molecular dynamics, it does require experimental values. According to this model, the above reaction follows non-statistical dynamics about 75% of the time.
References
(1) Samanta, D.; Rana, A.; Schmittel, M. "Quantification of Nonstatistical Dynamics in an Intramolecular Diels–Alder Cyclization without Trajectory Computation," J. Org. Chem. 2014, 79, 2368-2376, DOI: 10.1021/jo500035b.
InChIs
1: InChI=1S/C28H29NSi/c1-29(2)27-17-11-16-26(22-27)28(30(3,4)5)21-20-25-15-10-9-14-24(25)19-18-23-12-7-6-8-13-23/h6-17,20,22H,1-5H3
InChIKey=CKQXQJAGCGSOOP-UHFFFAOYSA-N
5: InChI=1S/C28H29NSi/c1-29(2)24-17-11-16-22-27(24)25(19-12-7-6-8-13-19)26-21-15-10-9-14-20(21)18-23(26)28(22)30(3,4)5/h6-17H,18H2,1-5H3
InChIKey=OFALZDSJOVLMHZ-UHFFFAOYSA-N
5′: InChI=1S/C28H29NSi/c1-29(2)21-15-16-23-24(18-21)28(30(3,4)5)25-17-20-13-9-10-14-22(20)27(25)26(23)19-11-7-6-8-12-19/h6-16,18H,17H2,1-5H3
InChIKey=UQRNTADMKHTLNR-UHFFFAOYSA-N
